> ## Documentation Index
> Fetch the complete documentation index at: https://docs.nemu.com.br/llms.txt
> Use this file to discover all available pages before exploring further.
# Customer Analysis
> The Customers functionality allows you to deeply understand who your customers are, how they behave, and how your acquisition channels influence the entry of new and returning customers.
It unites two parts of the funnel that previously lived separately: campaign tracking + customer behavior.
## What it is
We automatically identify if a purchase was made by:
**New Customer** → never purchased before.
**Returning Customer** → has purchased at least once.
With this, you can analyze:
* Average Order Value
* CAC
* Repurchase Base
* Average time between purchases
* Purchase frequency
* Repurchase rate
* Total number of customers
* New vs. returning
* How many new/returning customers each channel, campaign, or ad brought (by attribution model)
And more: you can import your historical customer base via CSV, so Nemu recognizes old purchases that occurred before Pixel installation.
## Where to find the information
The functionality is divided into two places:
### A) "Customers" Tab - Sidebar
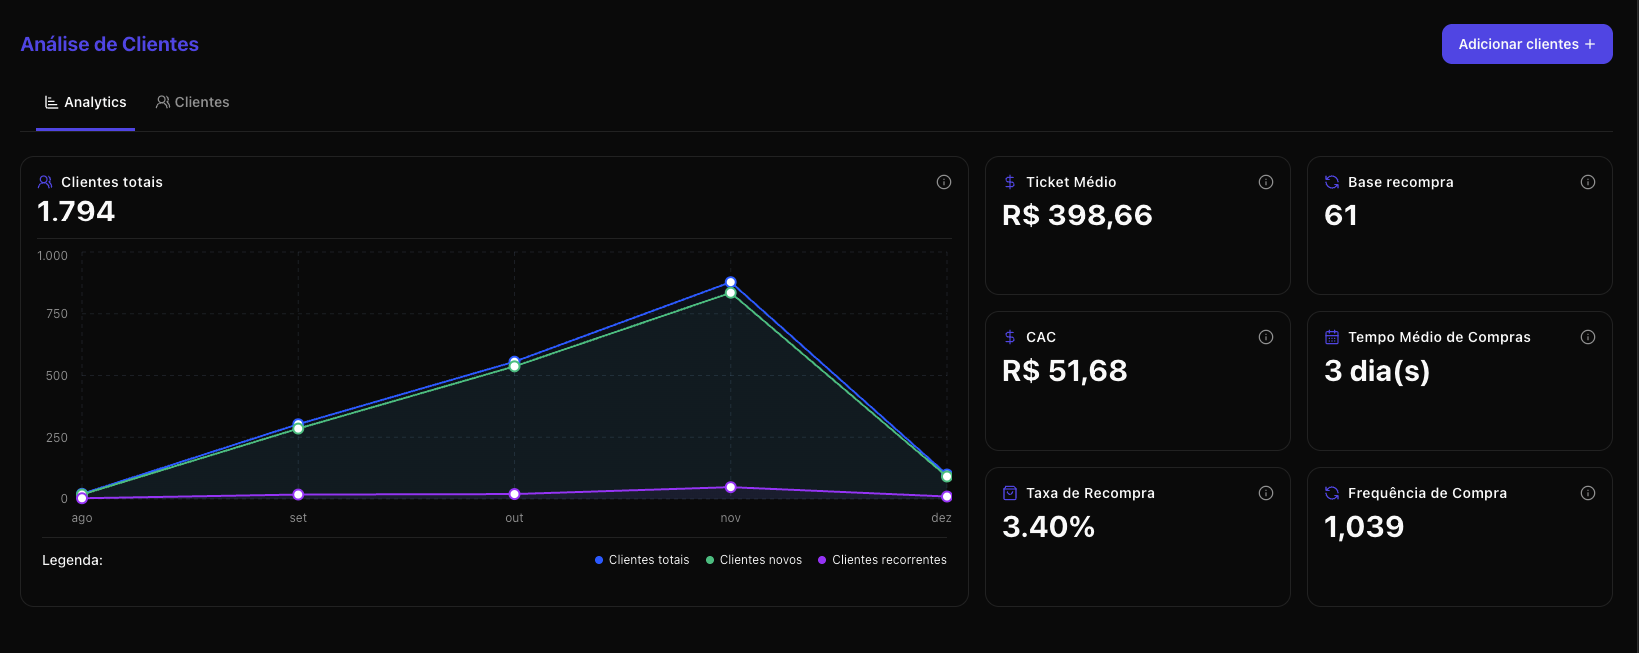
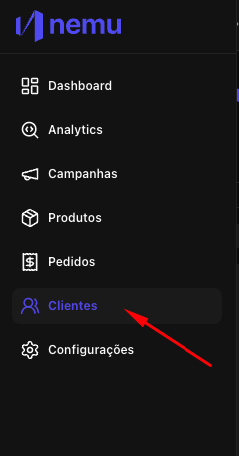 Where you find:
* General customer metrics
* Evolution chart
* Customer base upload
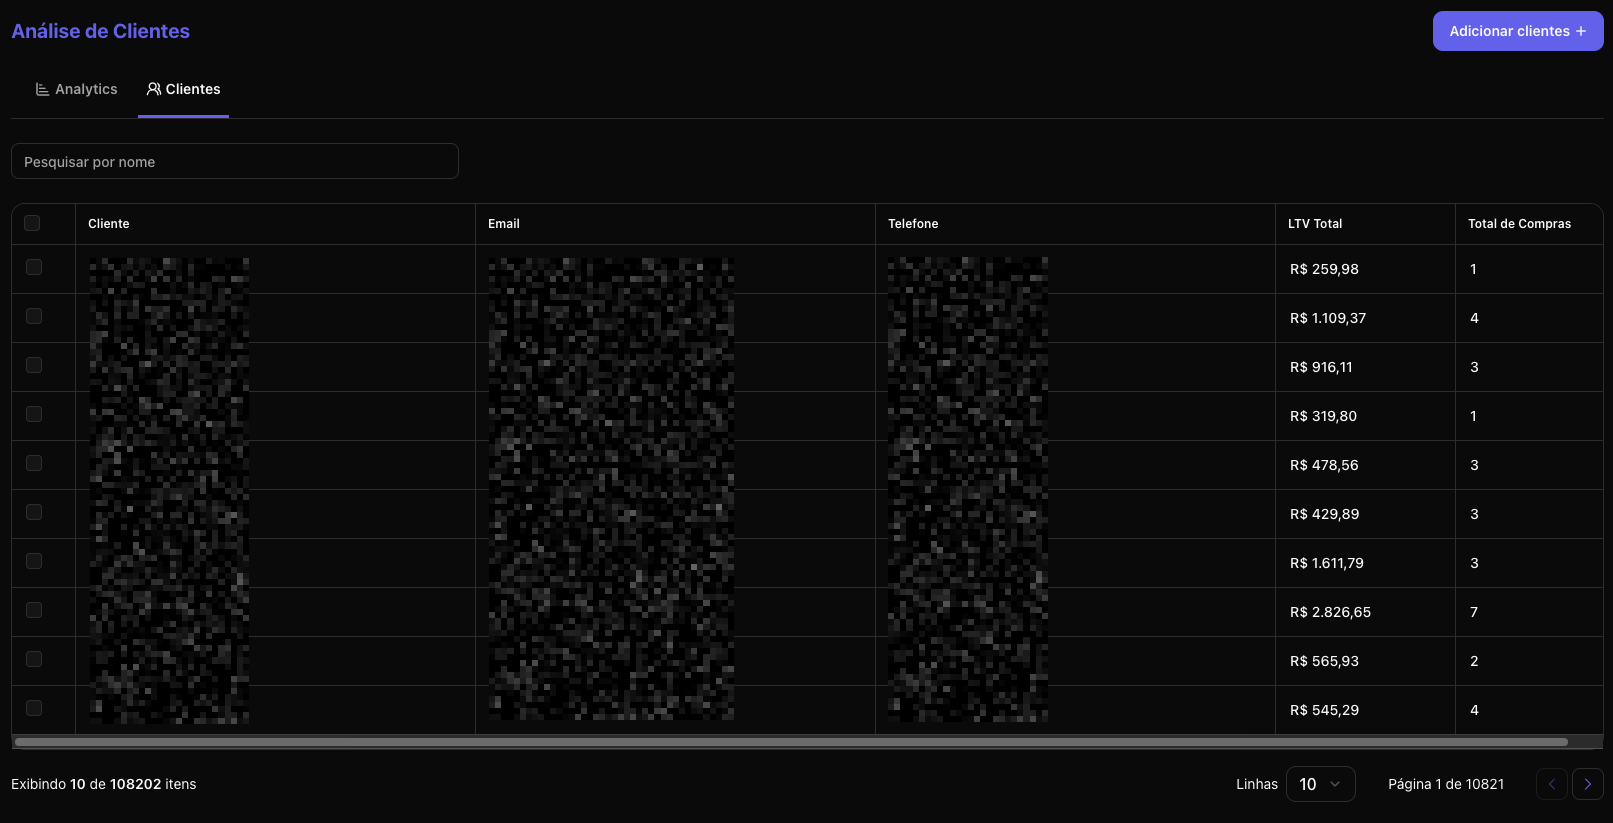
* Complete list of customers with LTV and total purchases
Where you find:
* General customer metrics
* Evolution chart
* Customer base upload
* Complete list of customers with LTV and total purchases
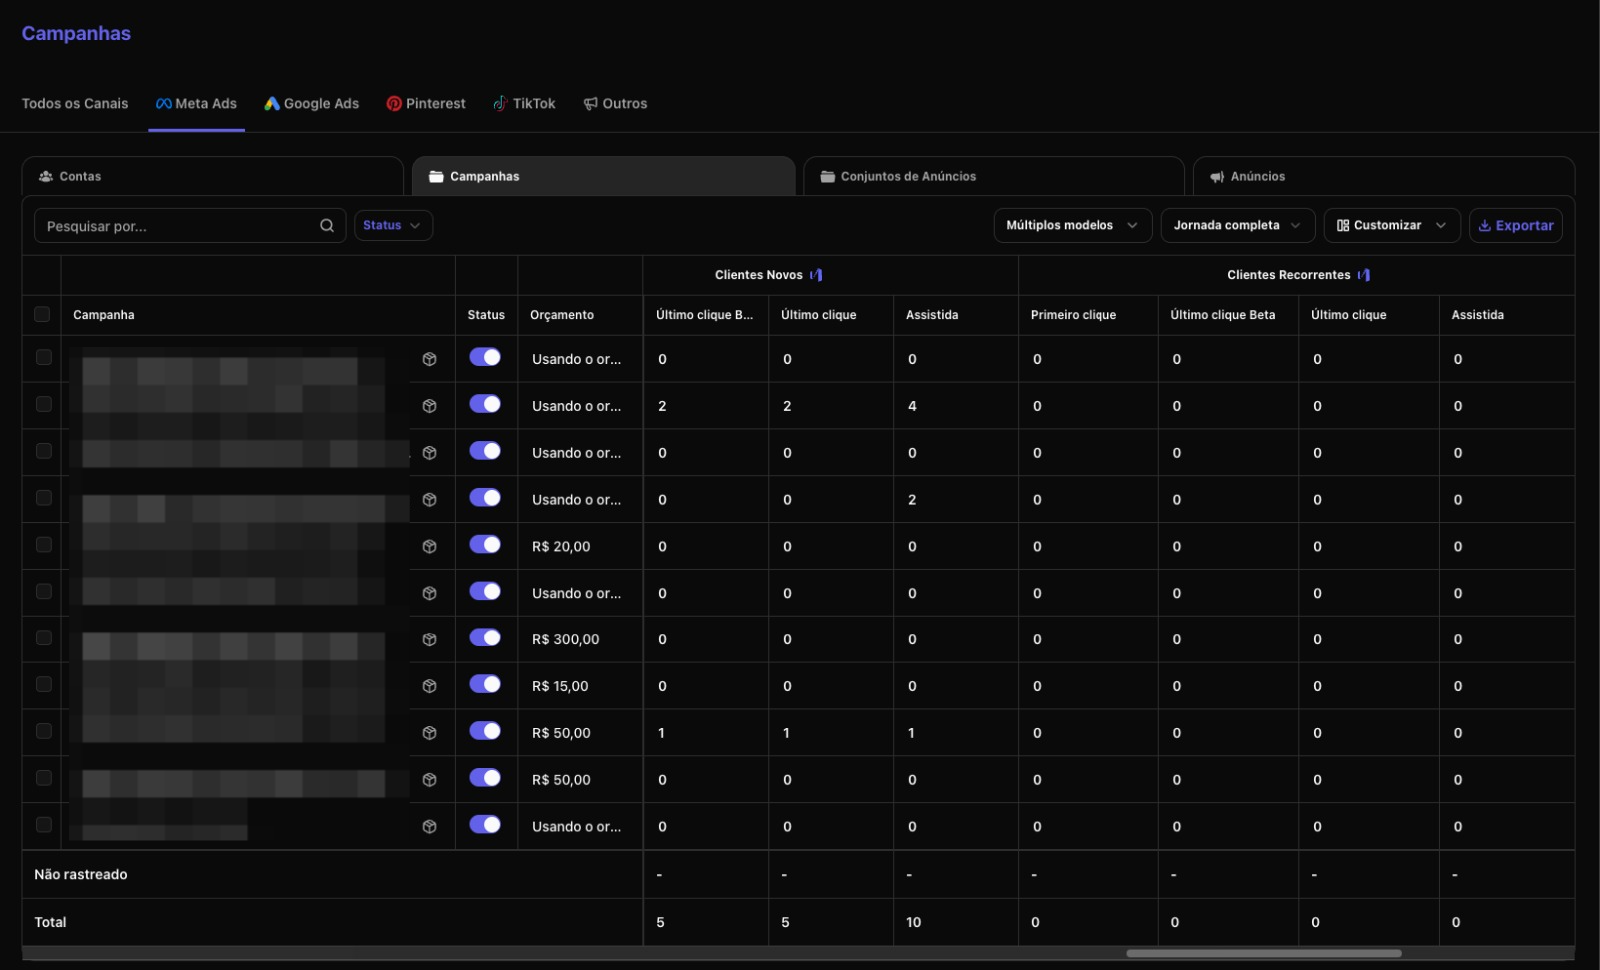
 ### B) "Customers" Columns in the "Campaigns" Tab
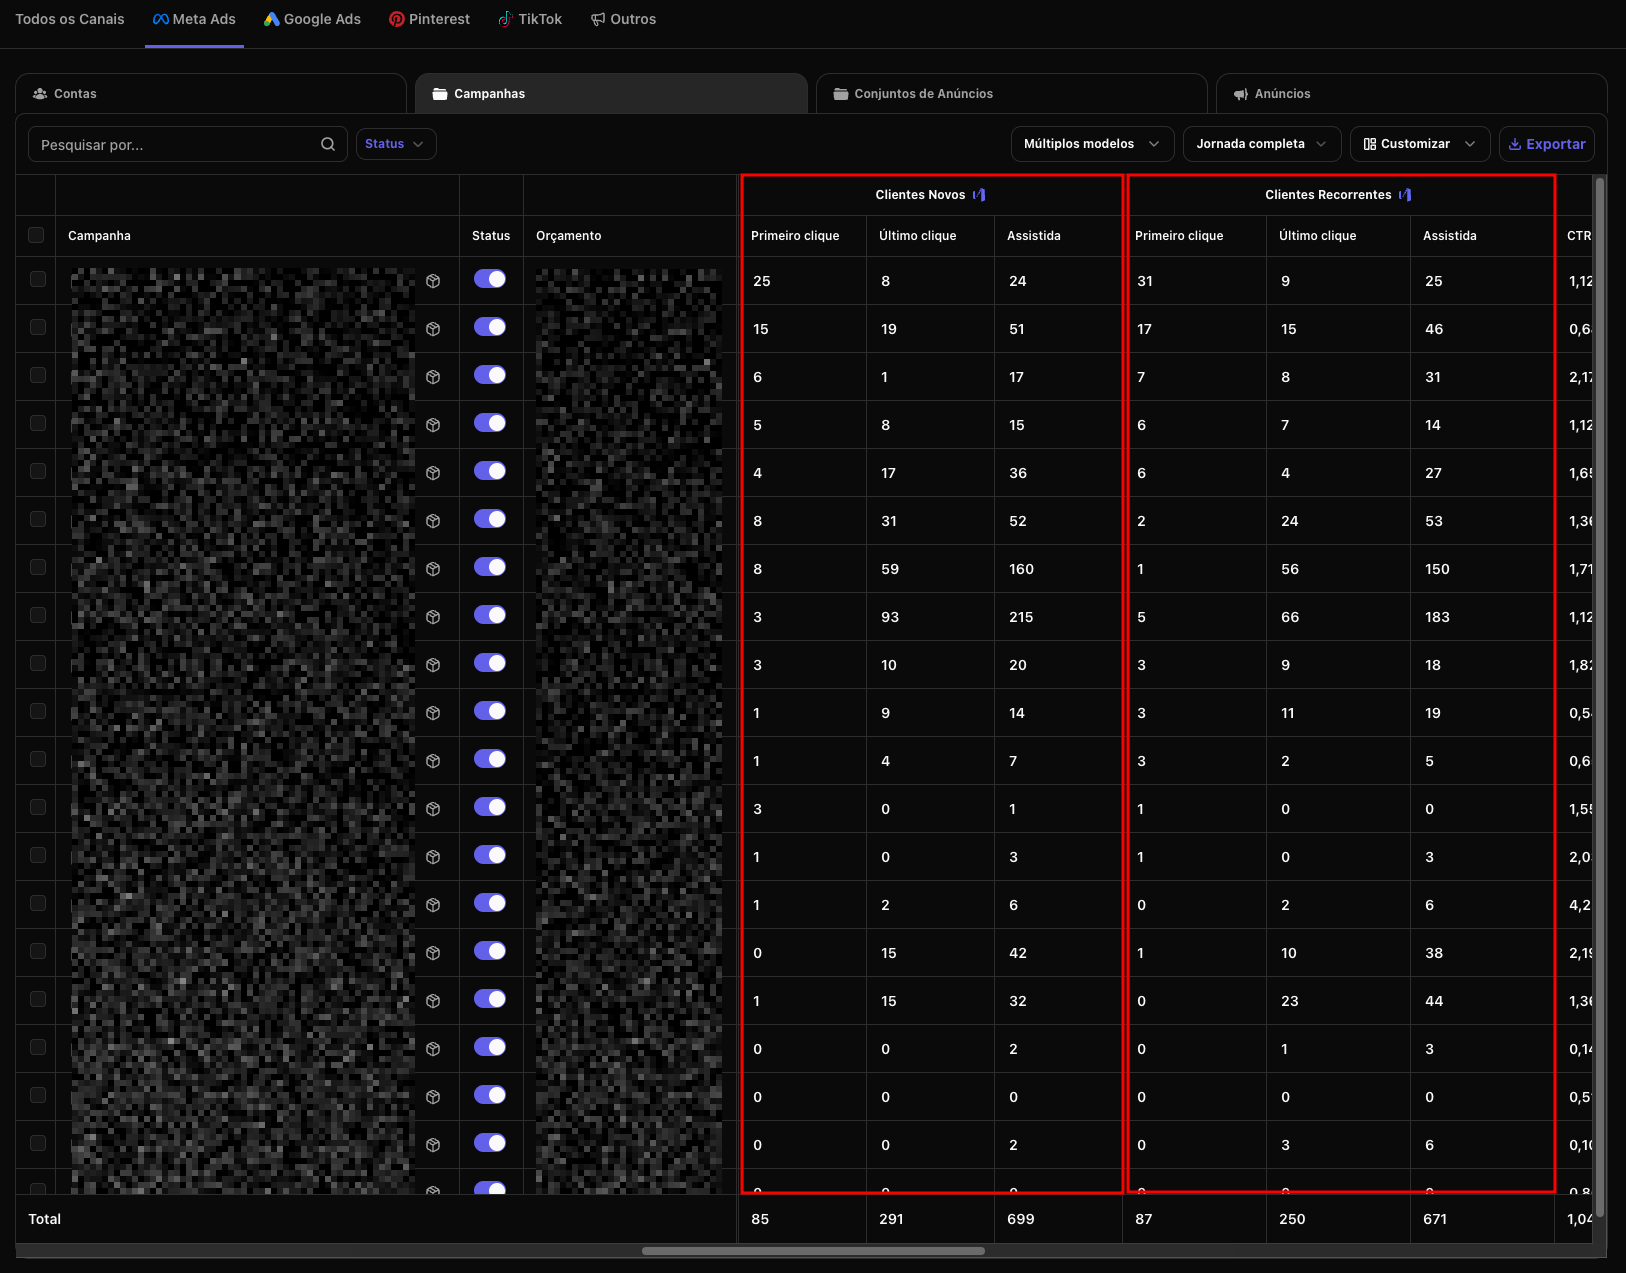
Now each channel shows:
* How many new customers that channel brought
* How many returning customers that channel brought
* Metrics by attribution model (First Click, Last Click, Full Journey)
### B) "Customers" Columns in the "Campaigns" Tab
Now each channel shows:
* How many new customers that channel brought
* How many returning customers that channel brought
* Metrics by attribution model (First Click, Last Click, Full Journey)
 ## How customer identification works
From the moment you integrate your store or checkout with Nemu, we can:
* Recognize the buyer
* Assign them as new or returning
* Track that user in future purchases
But if the store existed before you started using Nemu, we don't have that history.
That's why we created the customer base upload functionality.
## How to upload your customer base
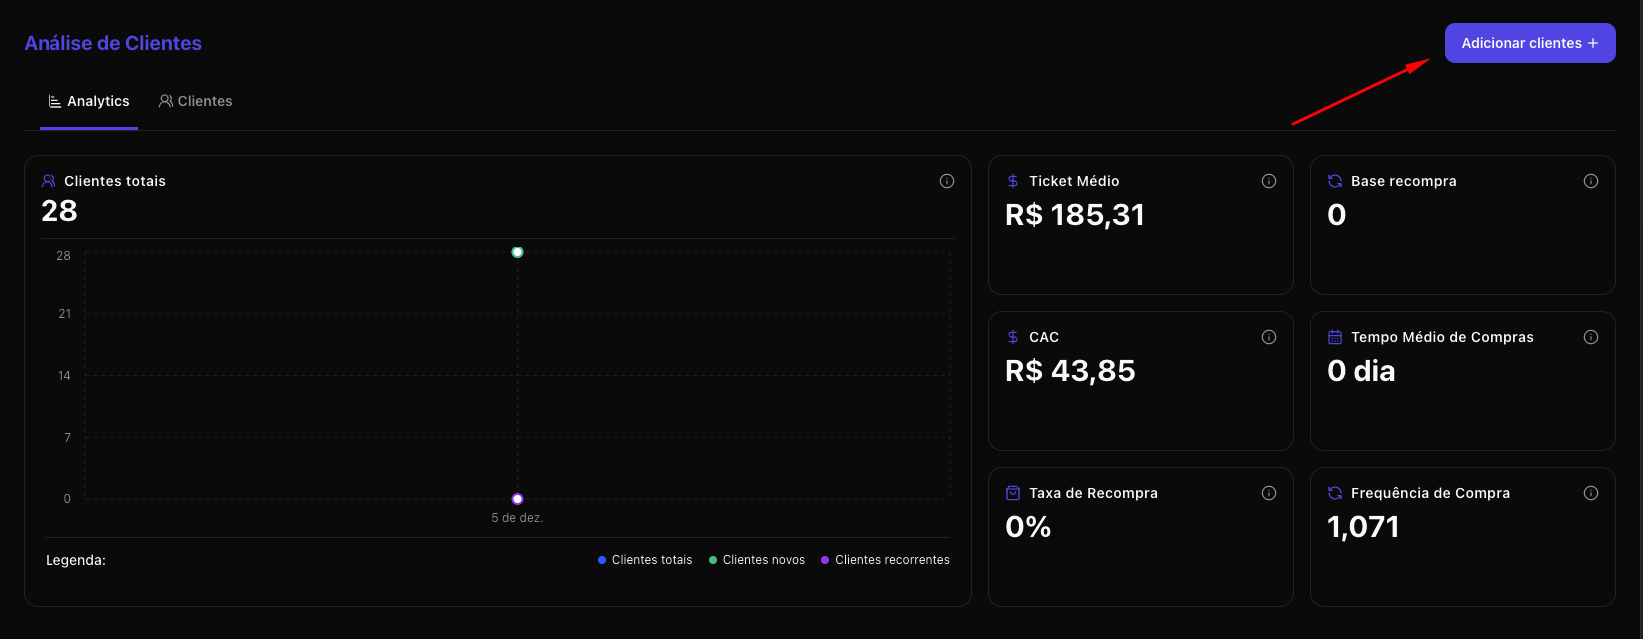
1. Click the **Add Customers +** button.
## How customer identification works
From the moment you integrate your store or checkout with Nemu, we can:
* Recognize the buyer
* Assign them as new or returning
* Track that user in future purchases
But if the store existed before you started using Nemu, we don't have that history.
That's why we created the customer base upload functionality.
## How to upload your customer base
1. Click the **Add Customers +** button.
 2. Download the CSV template.
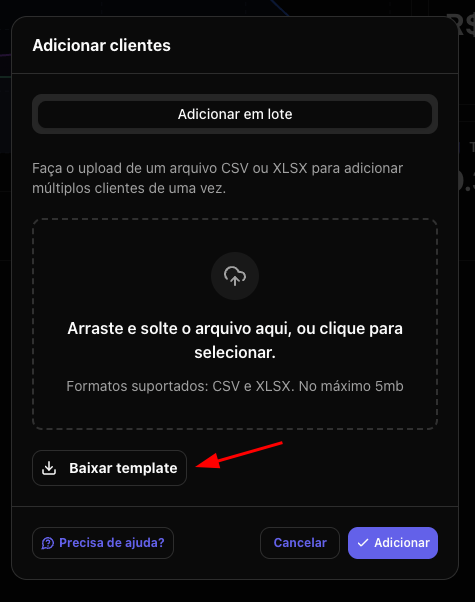 3. Fill in with:
* sale id
* product name (optional)
* net value
* gross value
* date (YYYY-MM-DD)
* customer email
* customer name (optional)
* customer phone (optional)
* platform (shopify, woocommerce, magento, etc)
4. Upload by dragging and dropping the file or clicking to select the file.
3. Fill in with:
* sale id
* product name (optional)
* net value
* gross value
* date (YYYY-MM-DD)
* customer email
* customer name (optional)
* customer phone (optional)
* platform (shopify, woocommerce, magento, etc)
4. Upload by dragging and dropping the file or clicking to select the file.
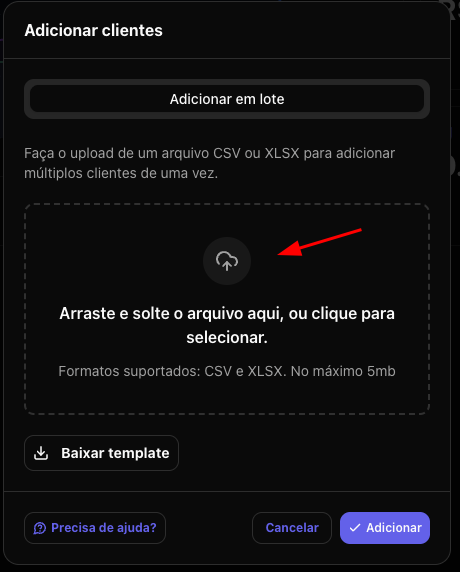 > **Accepted files: CSV or XLSX**
Nemu starts recognizing all these customers as already existing.
From that point on, any new purchases from these customers will be correctly classified as returning — even if the first purchase was before the Pixel.
## What you can analyze in the "Customers" Tab
### A) Main Metrics
* **Average Order Value**
* **CAC**
* **Repurchase Base**
* **Average Time Between Purchases**
* **Purchase Frequency**
* **Repurchase Rate**
* **Total, New, and Returning Customers**
> **Accepted files: CSV or XLSX**
Nemu starts recognizing all these customers as already existing.
From that point on, any new purchases from these customers will be correctly classified as returning — even if the first purchase was before the Pixel.
## What you can analyze in the "Customers" Tab
### A) Main Metrics
* **Average Order Value**
* **CAC**
* **Repurchase Base**
* **Average Time Between Purchases**
* **Purchase Frequency**
* **Repurchase Rate**
* **Total, New, and Returning Customers**
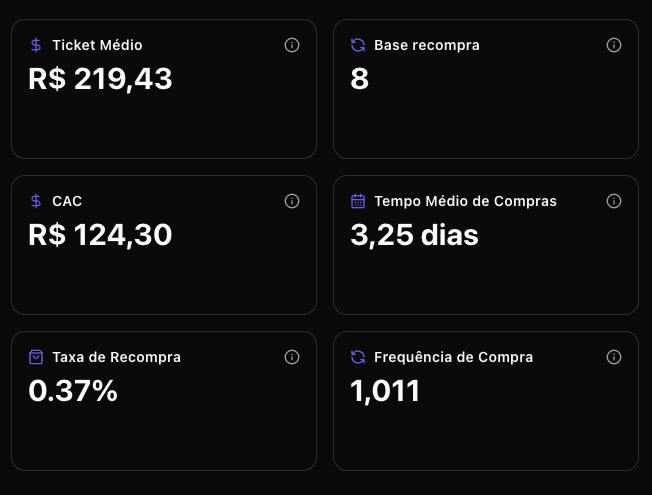 These metrics are crucial to understand:
* The health of your retention funnel
* The balance between acquisition and loyalty
* Your users' purchase cycle
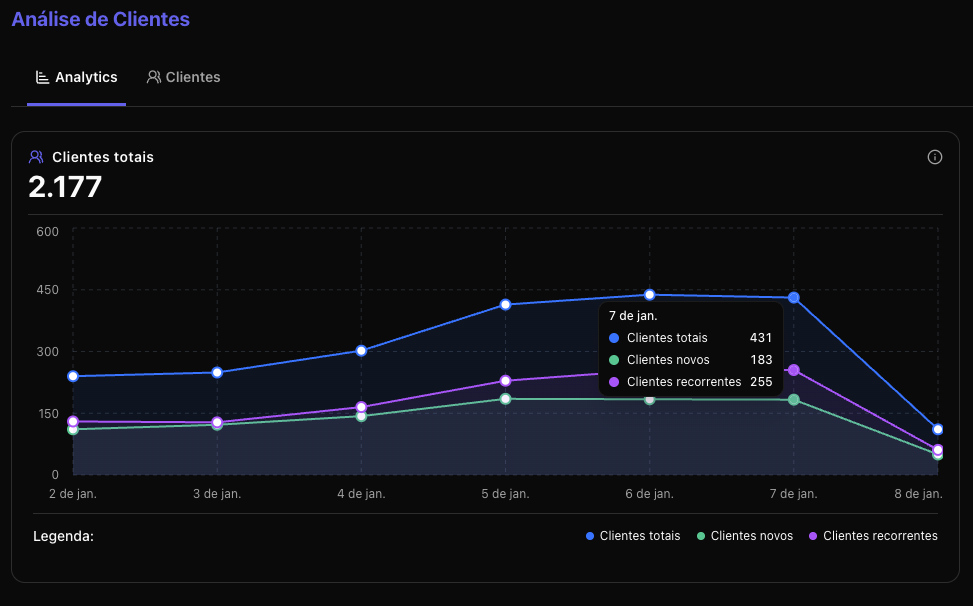
### B) Evolution Chart
You view week by week:
* Total Customers
* New Customers
* Returning Customers
Perfect for understanding trends of:
* Growth
* Seasonality
* Campaign effects
* Behavioral changes
These metrics are crucial to understand:
* The health of your retention funnel
* The balance between acquisition and loyalty
* Your users' purchase cycle
### B) Evolution Chart
You view week by week:
* Total Customers
* New Customers
* Returning Customers
Perfect for understanding trends of:
* Growth
* Seasonality
* Campaign effects
* Behavioral changes
 ### C) Customer List
Here you find:
* Name
* Email
* Phone
* LTV
* Total purchases
Ideal for specific analyses and segmentations.
### C) Customer List
Here you find:
* Name
* Email
* Phone
* LTV
* Total purchases
Ideal for specific analyses and segmentations.
 ## How to use this in the "Campaigns" Tab
This is one of the most powerful parts of the functionality.
Now you can see, for each channel, campaign, and ad:
* How many new customers that channel brought
* How many returning customers it brought back
* What the ROI/ROAS is based on First Click, Last Click, and all Nemu models
* Performance comparison by customer type
## How to use this in the "Campaigns" Tab
This is one of the most powerful parts of the functionality.
Now you can see, for each channel, campaign, and ad:
* How many new customers that channel brought
* How many returning customers it brought back
* What the ROI/ROAS is based on First Click, Last Click, and all Nemu models
* Performance comparison by customer type
 ### Examples of possible analyses:
#### 1) Where are we acquiring the most new customers?
See which channels are bringing the most first-time purchases.
Perfect for aggressive acquisition strategies.
#### 2) Which channels bring returning customers most frequently?
Understand who activates your current base.
Excellent for retention and CRM strategies.
#### 3) CAC by New vs. Returning Customer
Some channels may seem bad overall but great for bringing new customers.
#### 4) Test attribution models
See how the First Click view changes your perception of "new customer".
See how Last Click changes your perception of "returning customer".
### Examples of possible analyses:
#### 1) Where are we acquiring the most new customers?
See which channels are bringing the most first-time purchases.
Perfect for aggressive acquisition strategies.
#### 2) Which channels bring returning customers most frequently?
Understand who activates your current base.
Excellent for retention and CRM strategies.
#### 3) CAC by New vs. Returning Customer
Some channels may seem bad overall but great for bringing new customers.
#### 4) Test attribution models
See how the First Click view changes your perception of "new customer".
See how Last Click changes your perception of "returning customer".