1. What changed?
Now you can:- Easily identify PMAX campaigns through a “PMAX” tag
- View Resource Groups from PMAX campaigns
- Analyze metrics at the level:
- Campaign
- Resource Group (in case of PMAX)
2. Where to find?
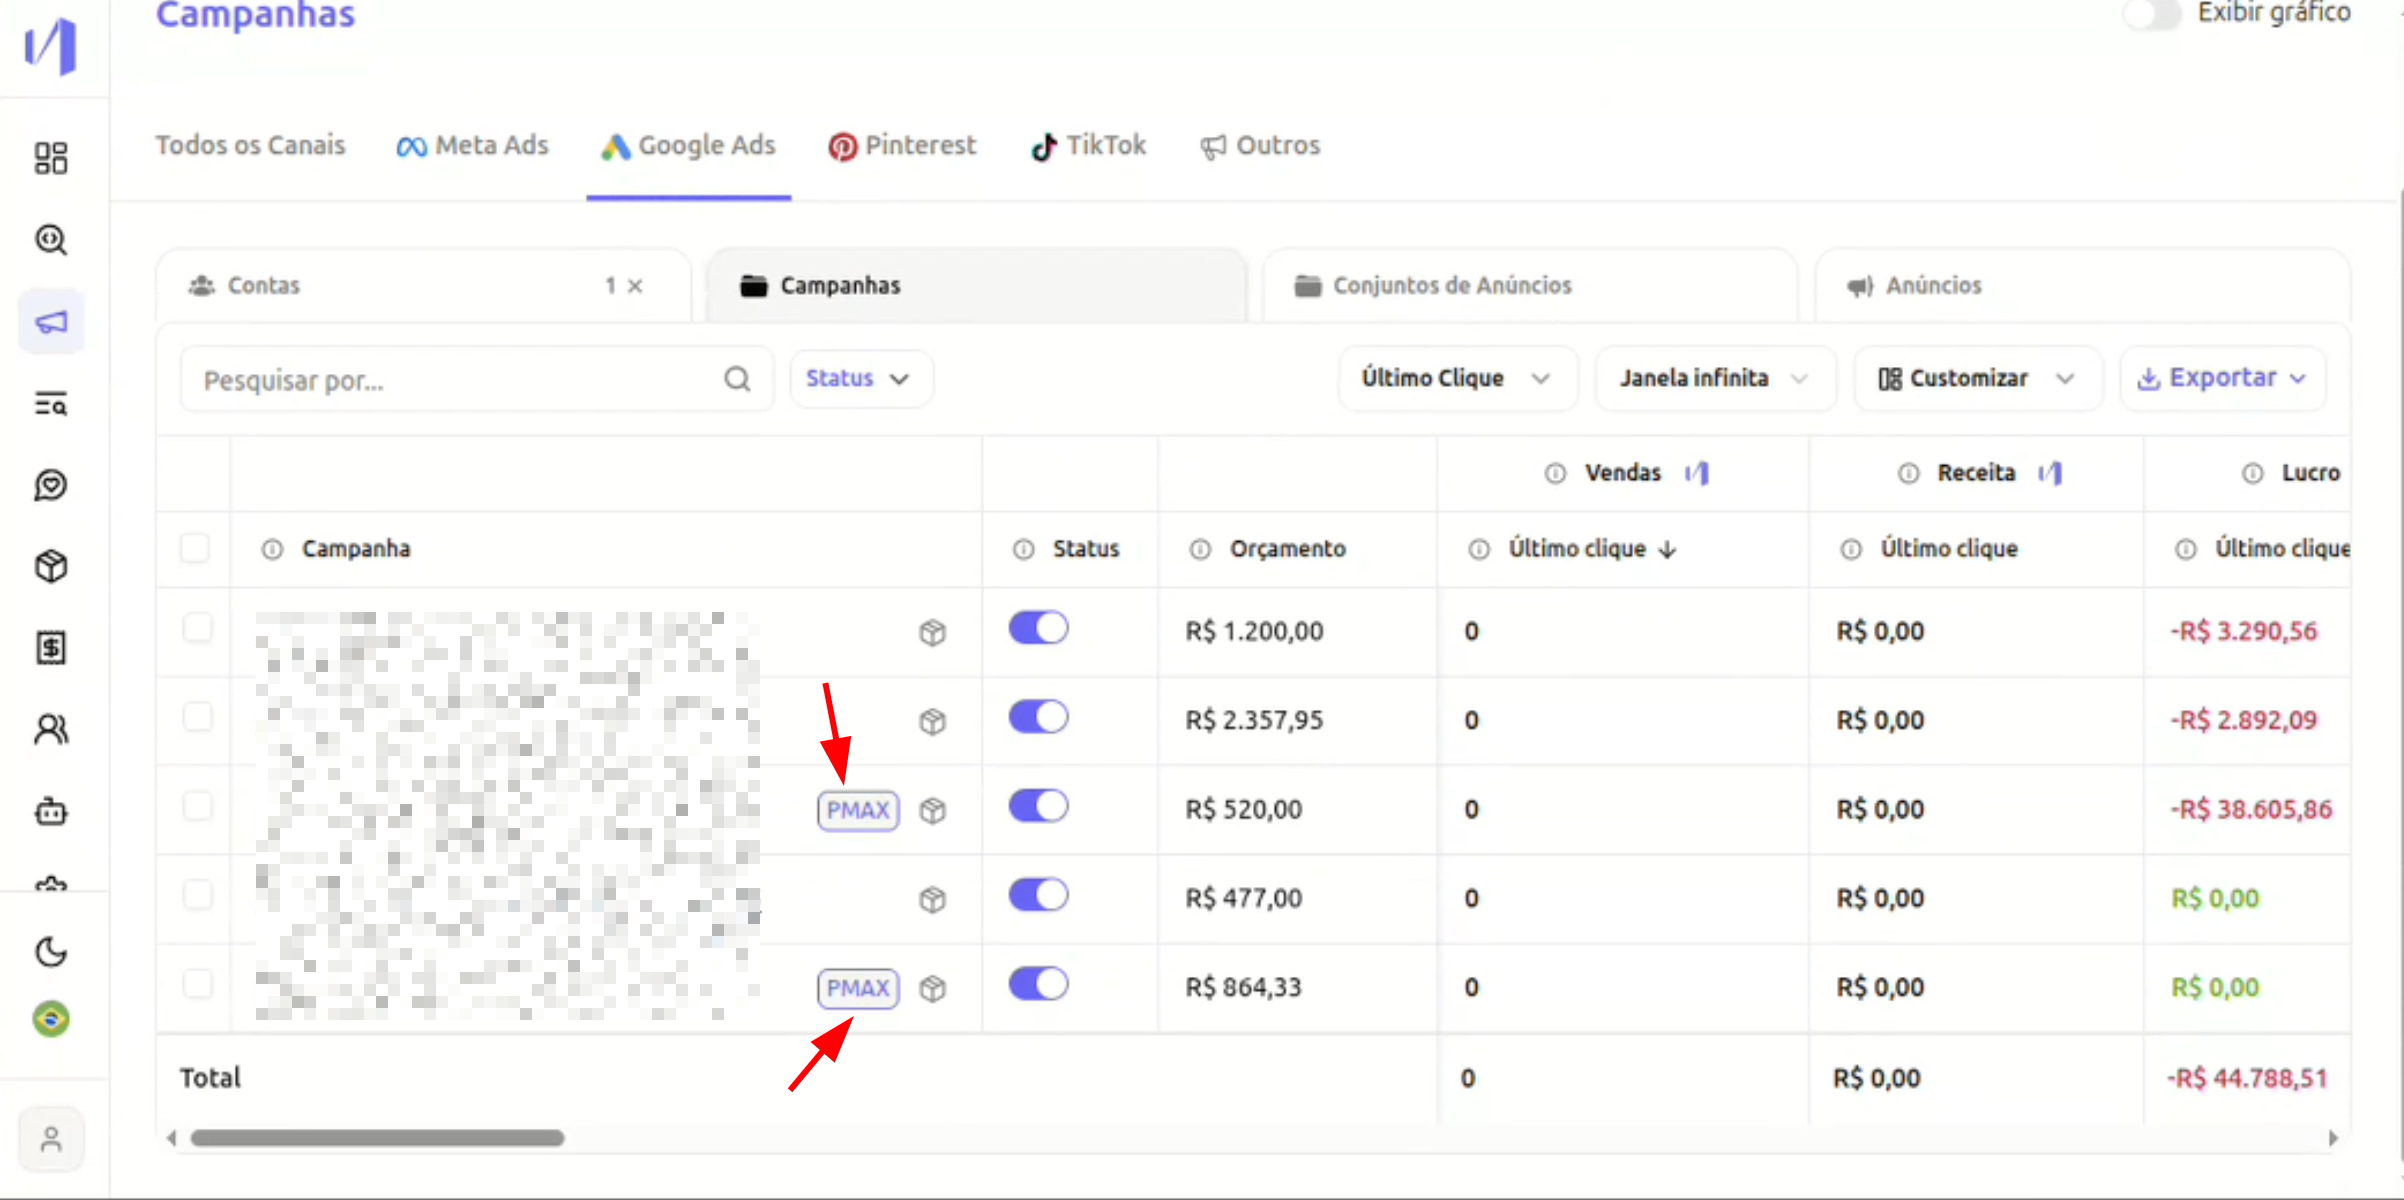
Access: Campaigns → Google AdsIn the “Campaigns” tab
PMAX campaigns appear with the PMAX tag next to the name. You can normally view metrics such as:- Impressions
- Clicks
- Revenue
- Profit
- ROAS
- Selected attribution model
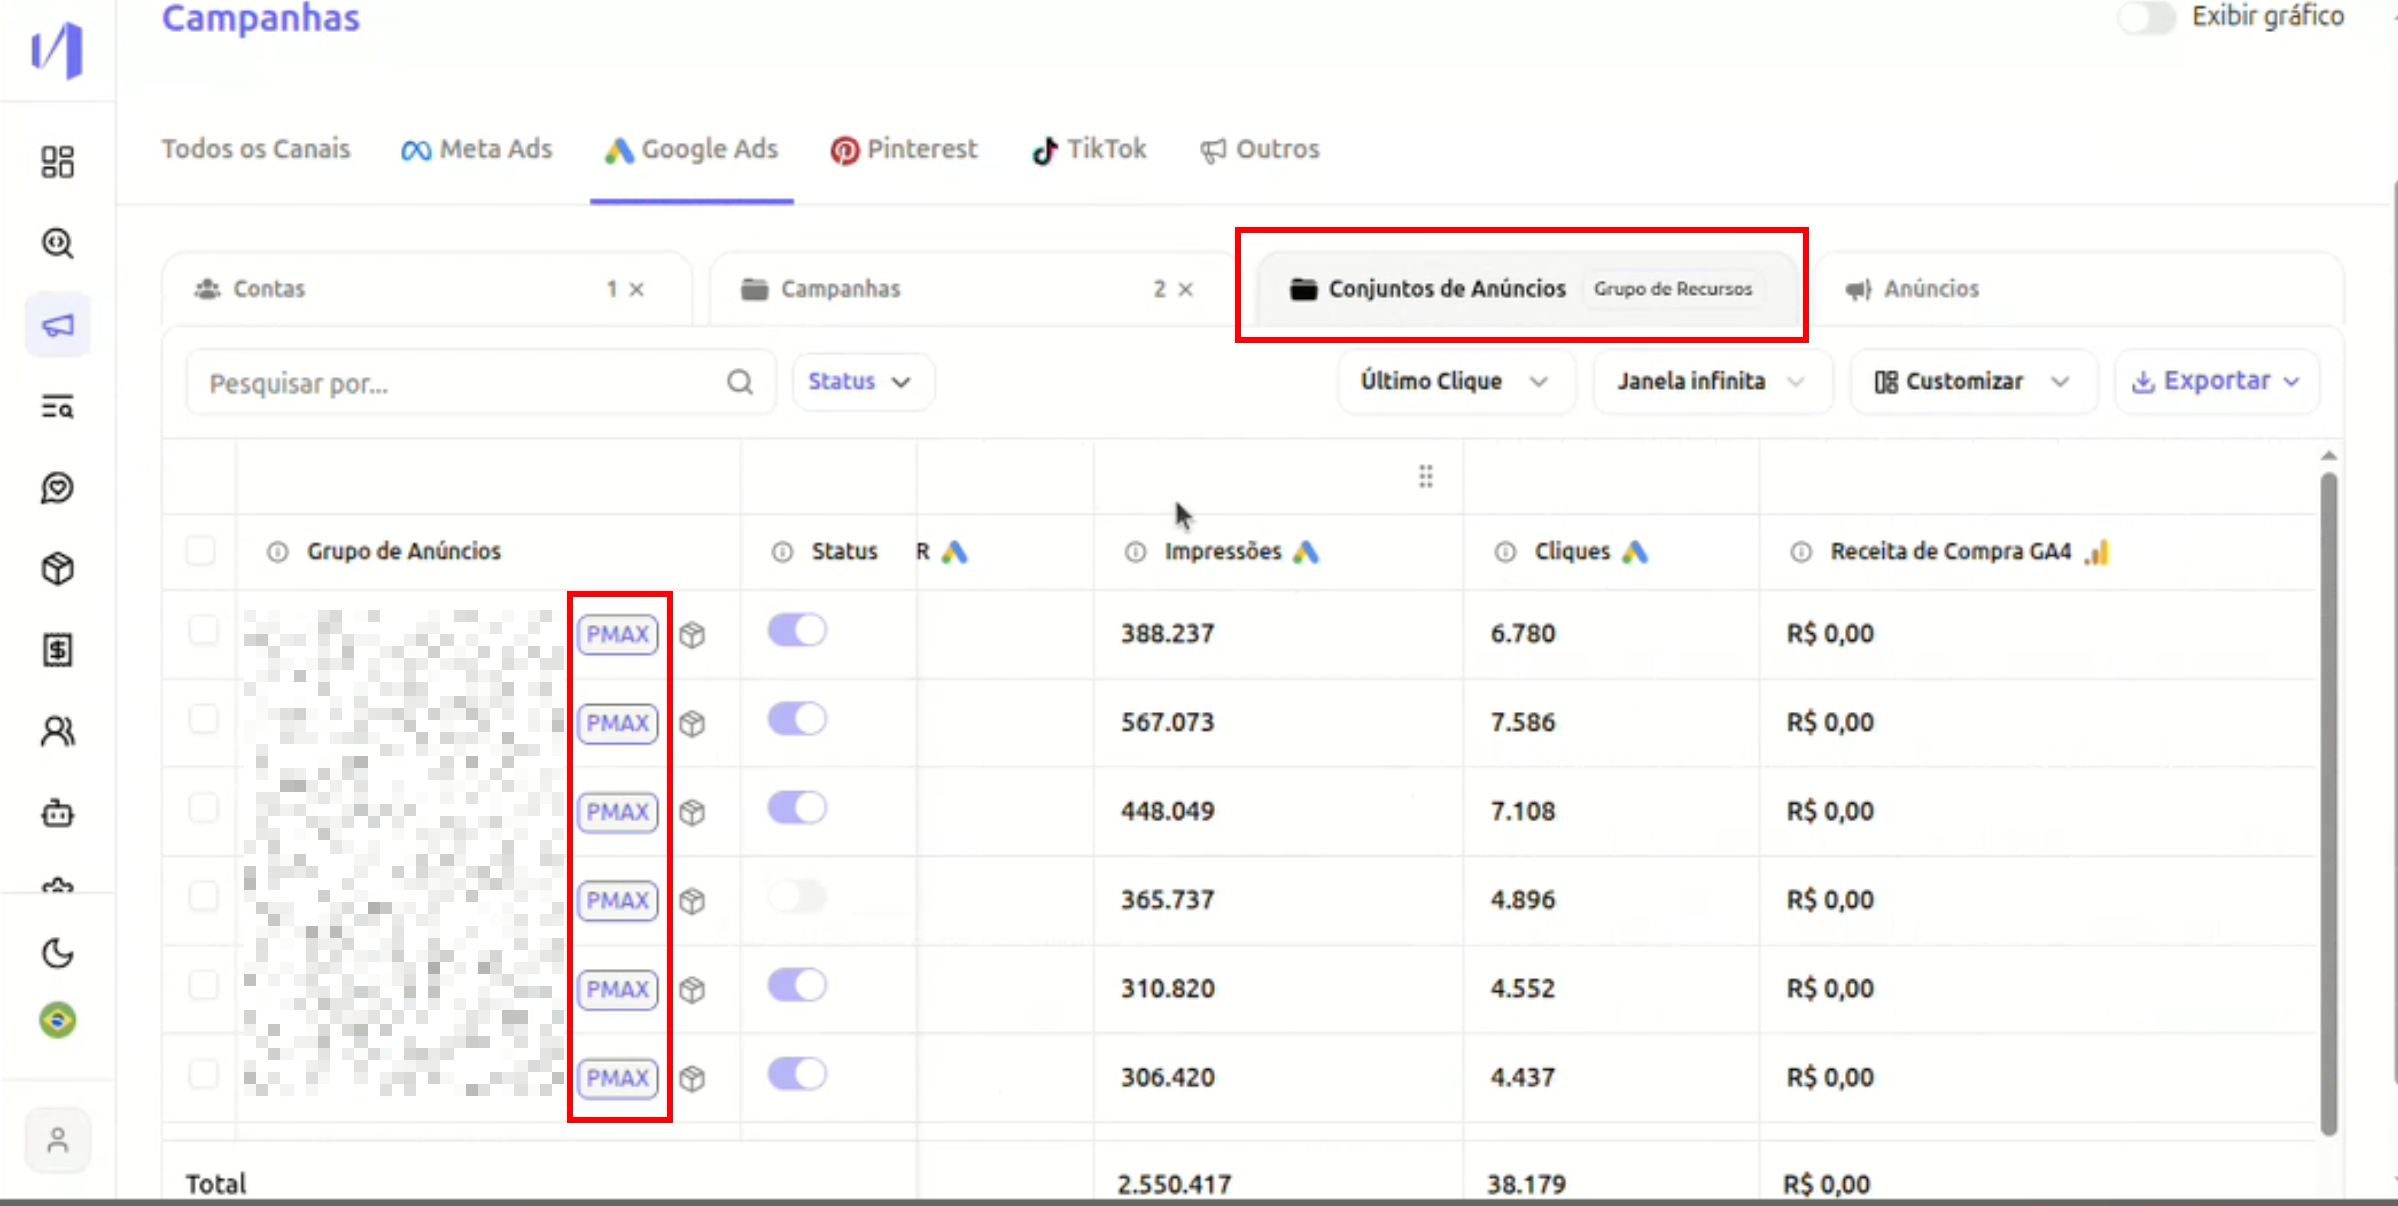
In the “Ad Sets” tab
If there is at least one PMAX campaign selected:- The interface will indicate that there are Resource Groups
- Next to the title, it will show that this view includes Resource Groups
- Resource groups are displayed in the table
3. What are Resource Groups?
In PMAX campaigns, Google does not use the traditional model of:- Campaign → Ad Set → Ads
- Campaign → Resource Group (Asset Group)
- Creatives
- Titles
- Descriptions
- Audiences
- Audience signals
4. How to use in practice?
Case 1: Compare performance between PMAX campaigns
- Go to Campaigns → Google Ads
- Filter or select PMAX campaigns
- Compare metrics normally
Case 2: Analyze performance within PMAX
- Select a PMAX campaign
- Go to the Ad Sets tab
- View Resource Groups
- Analyze:
- Impressions
- Clicks
- Revenue
- Performance by attribution model
- Which group is generating the most revenue
- Which creative structure is performing better
- If there is concentration of results in only one group
5. Important Notes
- Non-PMAX campaigns continue to work normally.
- Resource group view only appears when there is a PMAX campaign in the selected context.
- There is no impact on attribution or metric calculation — just expanded visibility.
Next Steps:
- Identify your PMAX campaigns by the tag next to the name.
- Compare performance between different PMAX campaigns.
- Analyze Resource Groups to understand the internal performance of each campaign.
- Use attribution models for deeper analyses.