1. Manage Tab
Here you view and organize all your products.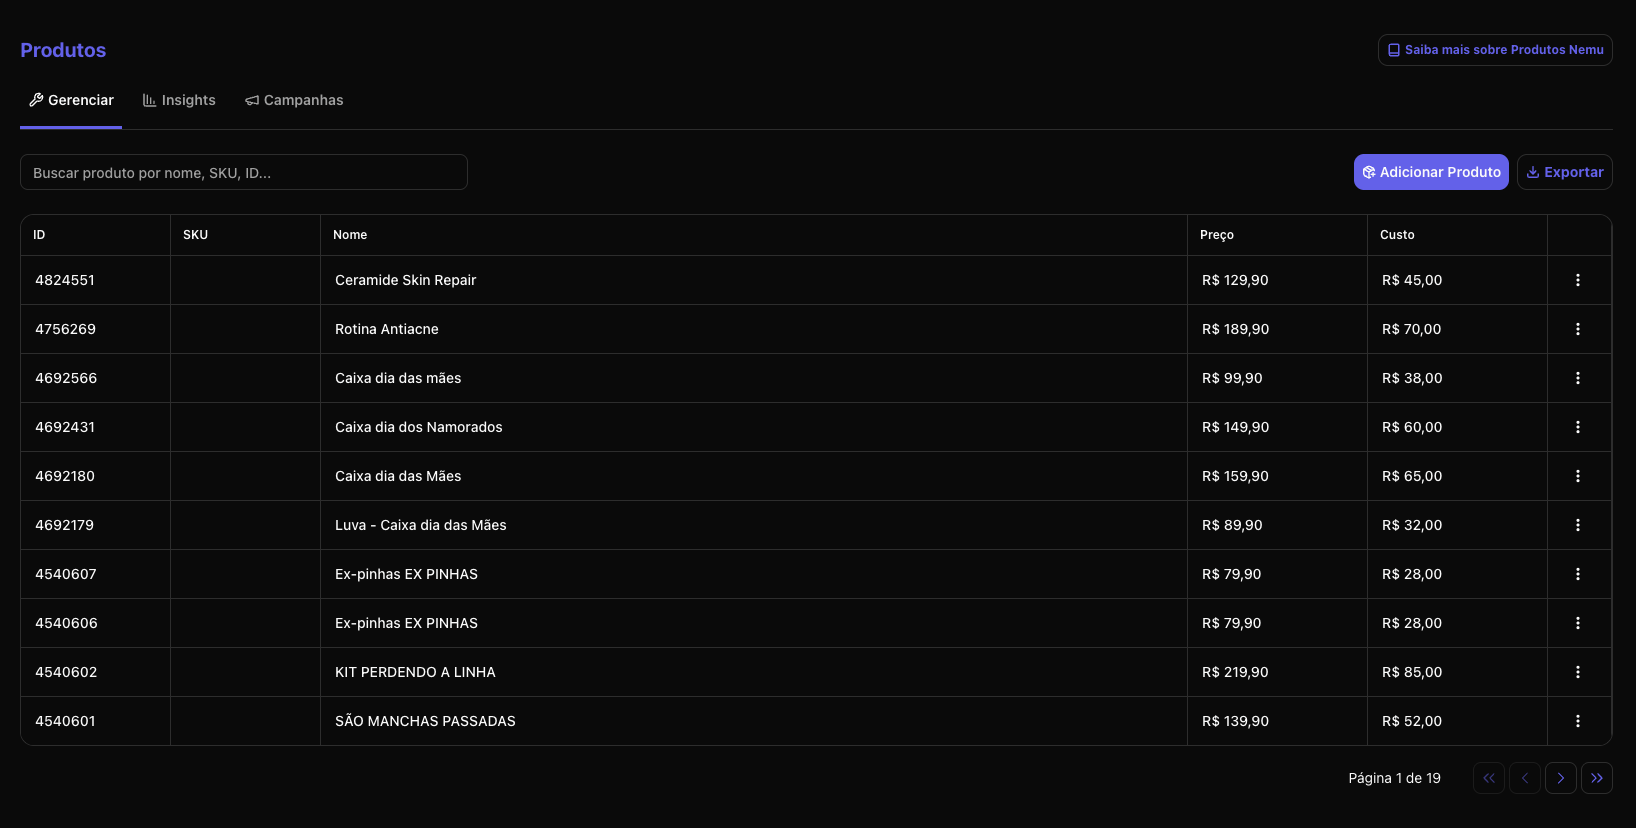
What you find:
- Product ID
- SKU
- Name
- Sale Price
- Cost
- Actions menu (⋯)
What you can do:
- Edit sale price and cost through the three-dot menu
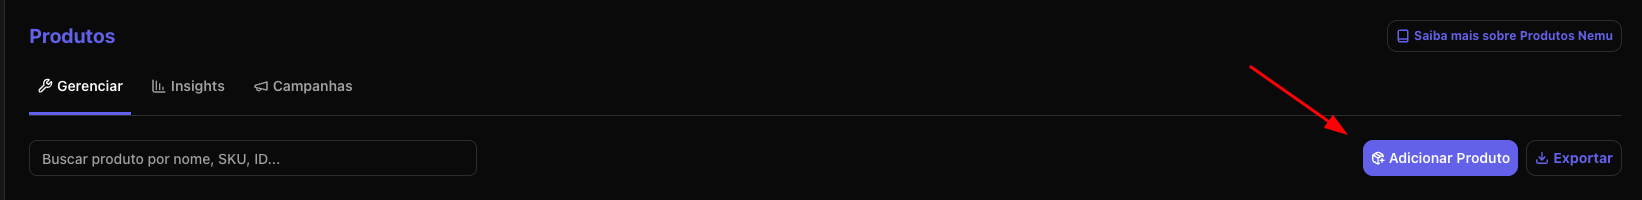
- Add a new product manually
- Export the product list
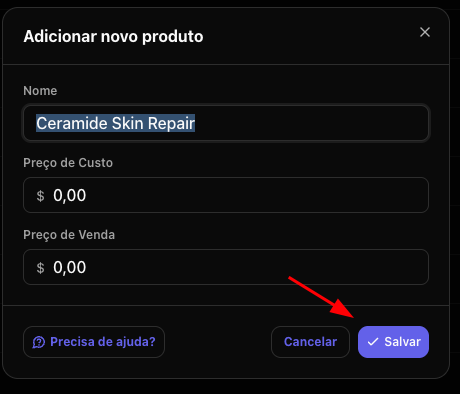
Adding a new product
- Click the “Add Product” button
- Fill in the fields:
- Name: Product name (required)
- ID SKU: Unique product identifier
- SKU: Product stock code
- Cost Price: Product cost value
- Sale Price: Product sale value
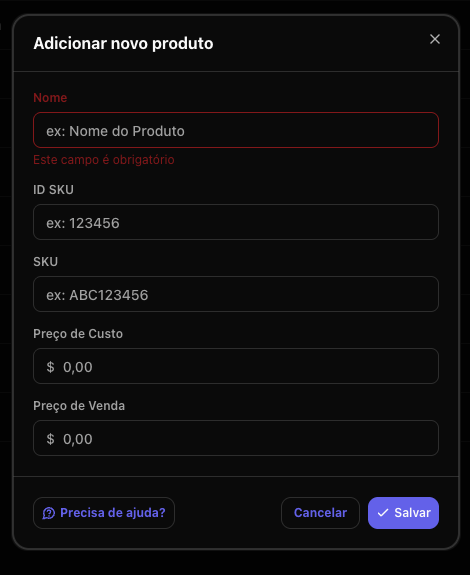
- Click Save to finish
Editing an existing product
- Click the three-dot menu (⋯) of the product you want to edit
- Select Edit
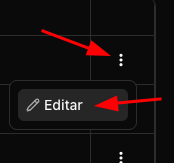
- Update the desired fields (sale price, cost, etc.)
- Click Save to apply the changes
What is it for?
Keeping price and cost updated allows for more accurate analyses of:- Margin per product
- Profitability
- Campaign performance considering profit, not just revenue
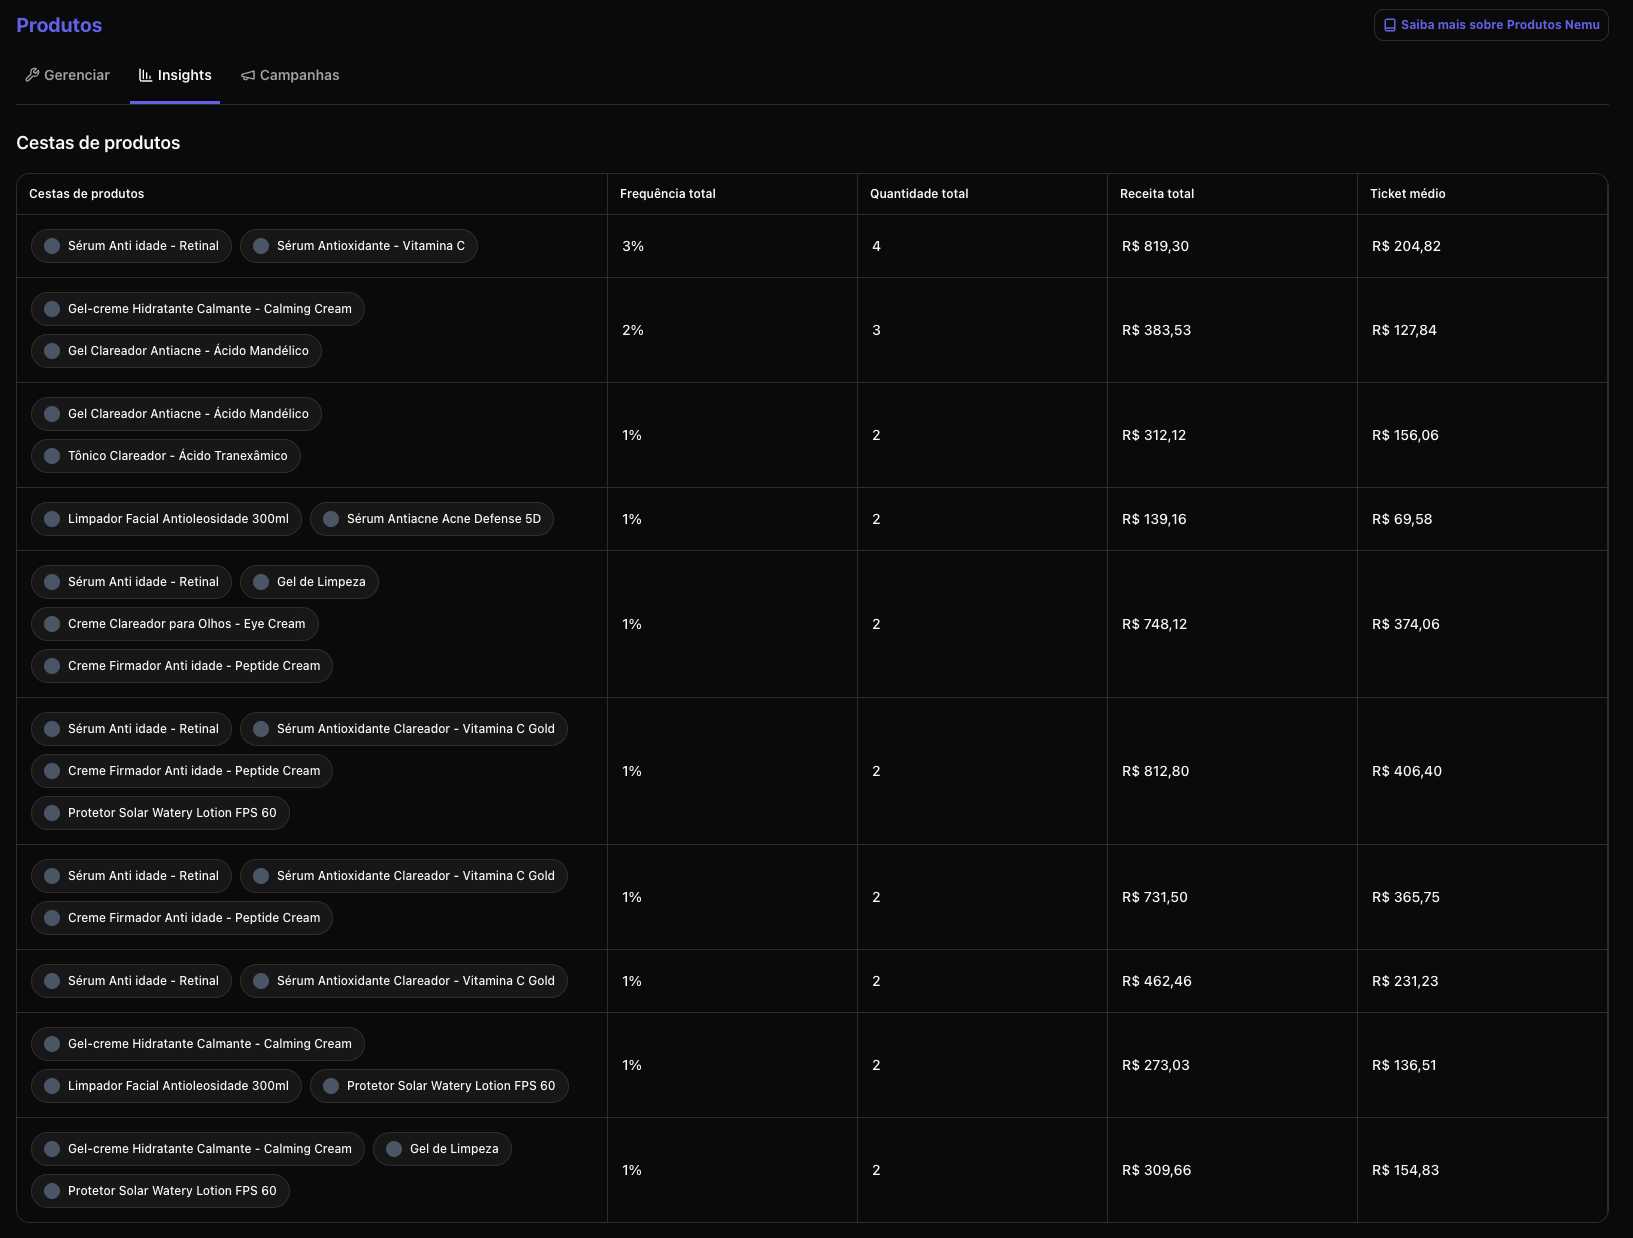
2. Insights Tab
Here you understand your customers’ purchasing behavior through product baskets.What are Product Baskets?
They are combinations of products purchased together in the same order. Example:- Product A + Product B
- Product A + Product C
The table shows:
- Product combination
- Frequency (%)
- Total quantity sold
- Total revenue
- Average ticket
What can you analyze?
✔ Which products have greater synergy✔ Ideas for creating kits
✔ Cross-sell opportunities
✔ Products that increase average ticket
✔ Joint promotion strategies Practical analysis examples:
- If two products appear frequently together → can become an official kit
- If a product greatly increases average ticket when combined → can be used as upsell
- If a product sells little alone but a lot in combination → it may depend on another to perform
- Pricing
- Bundles
- Business strategy
- Catalog organization
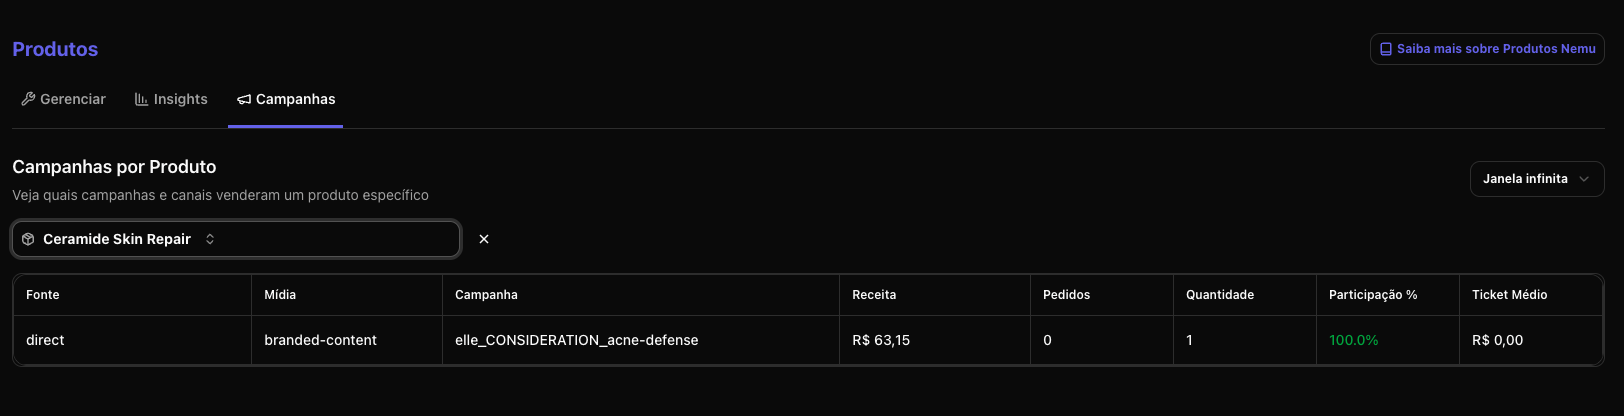
3. Campaigns Tab
Here you analyze the performance of a specific product by channel and campaign.How it works:
- Search for the product in the search bar
- Select the product
- See which channels and campaigns sold that item
The table presents:
- Source (e.g., Google, Meta, TikTok, Direct)
- Media
- Campaign
- Revenue
- Orders
- Quantity
- Participation %
- Average ticket
What you can analyze?
✔ Which channels sell a specific product the most✔ Which campaign generates the most revenue for that item
✔ Difference in average ticket by channel
✔ Participation of each channel in the product’s total
✔ Dependence on a single channel Strategic insight examples:
- A product may perform better on TikTok than Google
- There may be high revenue volume in Direct → indicating brand strength
- Average ticket may vary depending on the channel
- A channel may generate a lot of quantity but little revenue (promotional price)
- Adjust budget per product
- Create dedicated campaigns
- Optimize creatives for specific products
- Identify “hero” products by channel
How to use the Products Section strategically
You can use the three tabs together:- Manage → ensures correct price and cost data
- Insights → understands purchasing behavior
- Campaigns → understands acquisition performance
Recommended analysis flow:
- Identify a strategic product
- See which campaigns sell that product the most
- Analyze if it is sold alone or with others
- Evaluate if it makes sense to create kits or dedicated campaigns
- Adjust budget based on channel participation
When to use each tab?
Conclusion
The Products Section transforms your catalog into a strategic tool. You stop looking only at total revenue and start understanding:- How each product performs
- How they relate to each other
- Which channels really drive each item