

This feature is being rolled out gradually. If the Connect Google Sheets option doesn’t show up in your account, contact Nemu support.
What it is
Many companies invest in channels that have no native integration with Nemu, such as RTB, affiliates, influencers, CRM, radio or offline media. These amounts usually live in a spreadsheet. With the Google Sheets connection, Nemu reads that spreadsheet on its own, at the frequency you choose. New rows and corrections come in without uploading files again, and the spend shows up next to revenue in Analytics and Campaigns, with ROAS and profit per channel.Before you start
- Who can set it up: admins and traffic managers of the dashboard. For other roles, the buttons are disabled with the message “Only admins and traffic managers can change the connection.”
- A Google account with read access to the spreadsheet. It can be the account you already use in Nemu or another one, just for the spreadsheet. This connection is separate from the Google Ads connection.
- One spreadsheet per dashboard. Once connected, the menu option is renamed Manage connected spreadsheet.
- UTMs that match your links. Nemu sends each spend to the channel of the row’s UTMs. If the spreadsheet UTM differs from the one in your links, the spend goes to another channel.
Prepare the spreadsheet
Use a tab with spend only. The first row must be the header, and each following row is one investment. Totals and summary formulas in the middle of the data become rows with errors. In the wizard, you choose what each row represents:- A period: start date and end date columns, with the total amount. The amount is split evenly per day.
- A day: a single “Date” column and the amount spent on that day.
Example spreadsheet in the period format (the Nemu template uses Portuguese headers):
Don’t have a spreadsheet yet? In the wizard’s Spreadsheet and tab step, click Download the Nemu template (CSV) and import the file into Google Sheets.
Accepted formats
- Dates:
dd/mm/yyyy,mm/dd/yyyyoryyyy-mm-dd. Cells formatted as dates in Google Sheets are read directly. - Amounts: comma (
1.234,56) or dot (1,234.56) as the decimal separator. Currency symbols and codes (R$,US$,$,€,£,BRL,USD,EUR,GBP) are ignored. The amount is read in the dashboard currency, with no conversion. Negative amounts aren’t accepted. - Nemu recognizes common headers on its own, such as “Title”, “Source”, “Medium”, “Campaign”, “Start date”, “End date”, “Amount”, “Spend” and “ID” (and their Portuguese equivalents). If your header is different, you pick the column in the wizard.
Why map the row ID? With a stable identifier, a corrected amount replaces the previous record instead of being added to it. Without an ID, Nemu identifies the row by source, medium, campaign, content and start date (or the date, in the day format). If you change one of these fields, the row is treated as a new investment.
Connect the spreadsheet
1
Open the wizard
In the sidebar, go to Operating Costs › Investments by channel. Click Add and choose Connect Google Sheets. If the tab is still empty, you can also click the Connect Google Sheets card, marked as Recommended.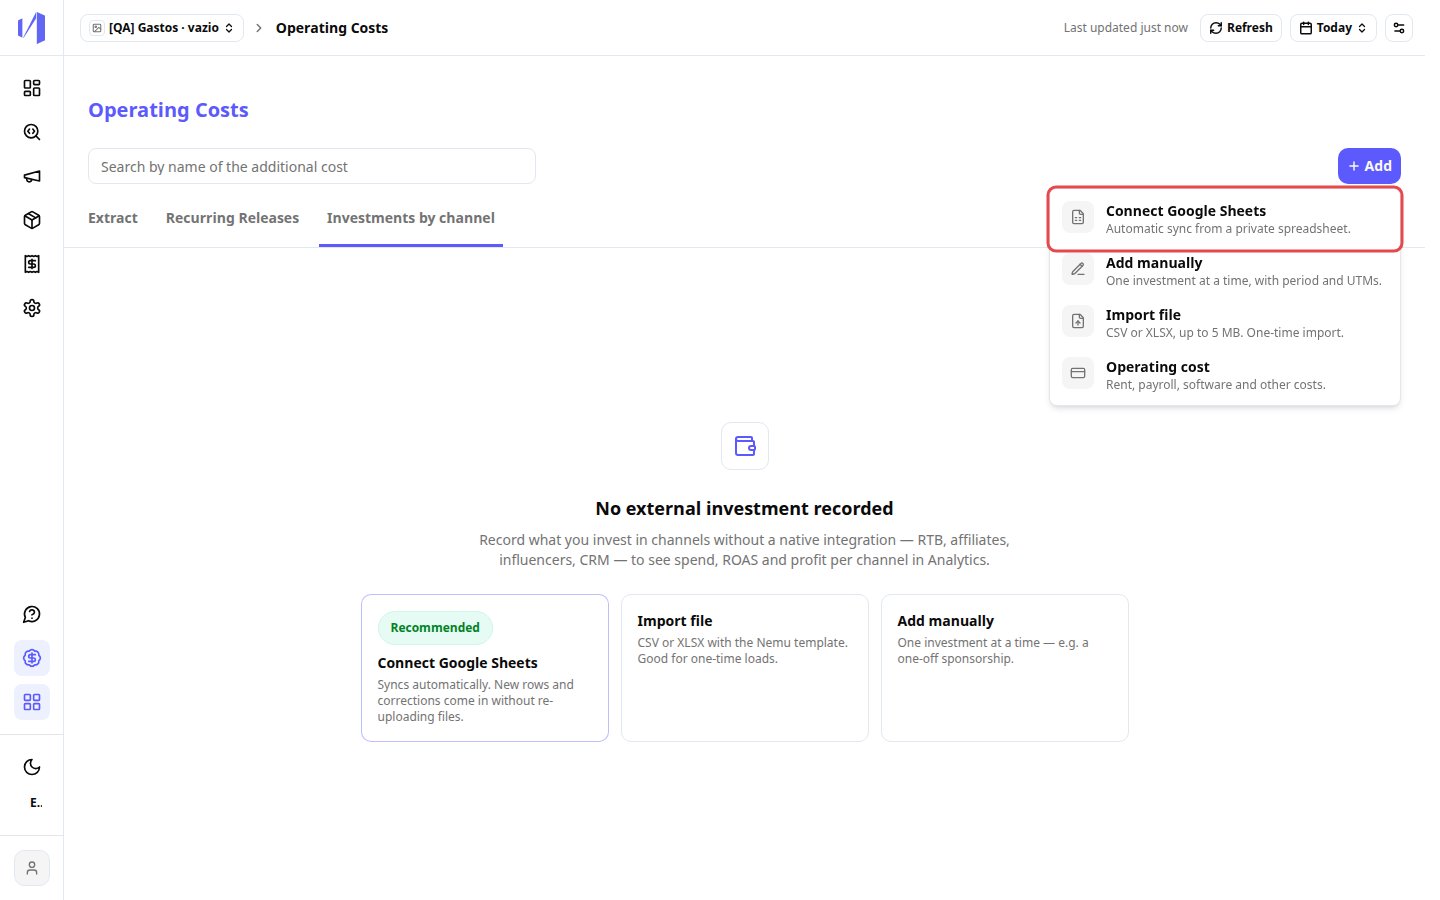
2
Authorize Google
The Authorize Google step shows what Nemu can and can’t do with the spreadsheet. Click Continue with Google. In the Google window, choose the account that has access to the spreadsheet and accept the read permission.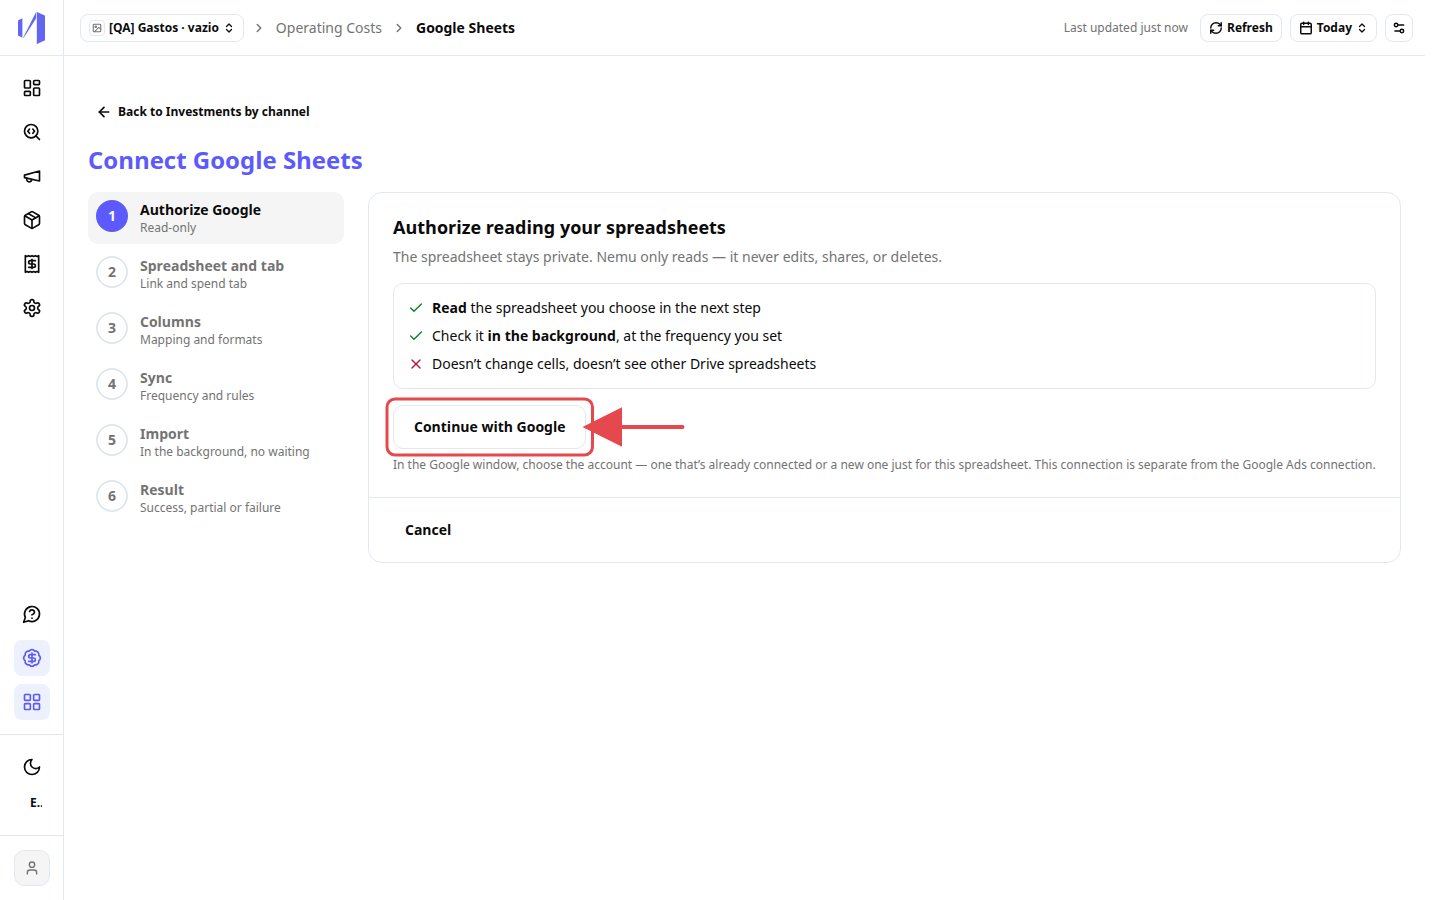
If the Google window doesn’t open, check your browser’s pop-up blocker.
3
Choose the spreadsheet and the tab
Click Choose from Google Drive (1) and select the spreadsheet. Nemu only accesses the spreadsheet you select. Once it’s found, its name and last edit date show up. Then, in Tab with the spend (2), choose the tab that holds the investments.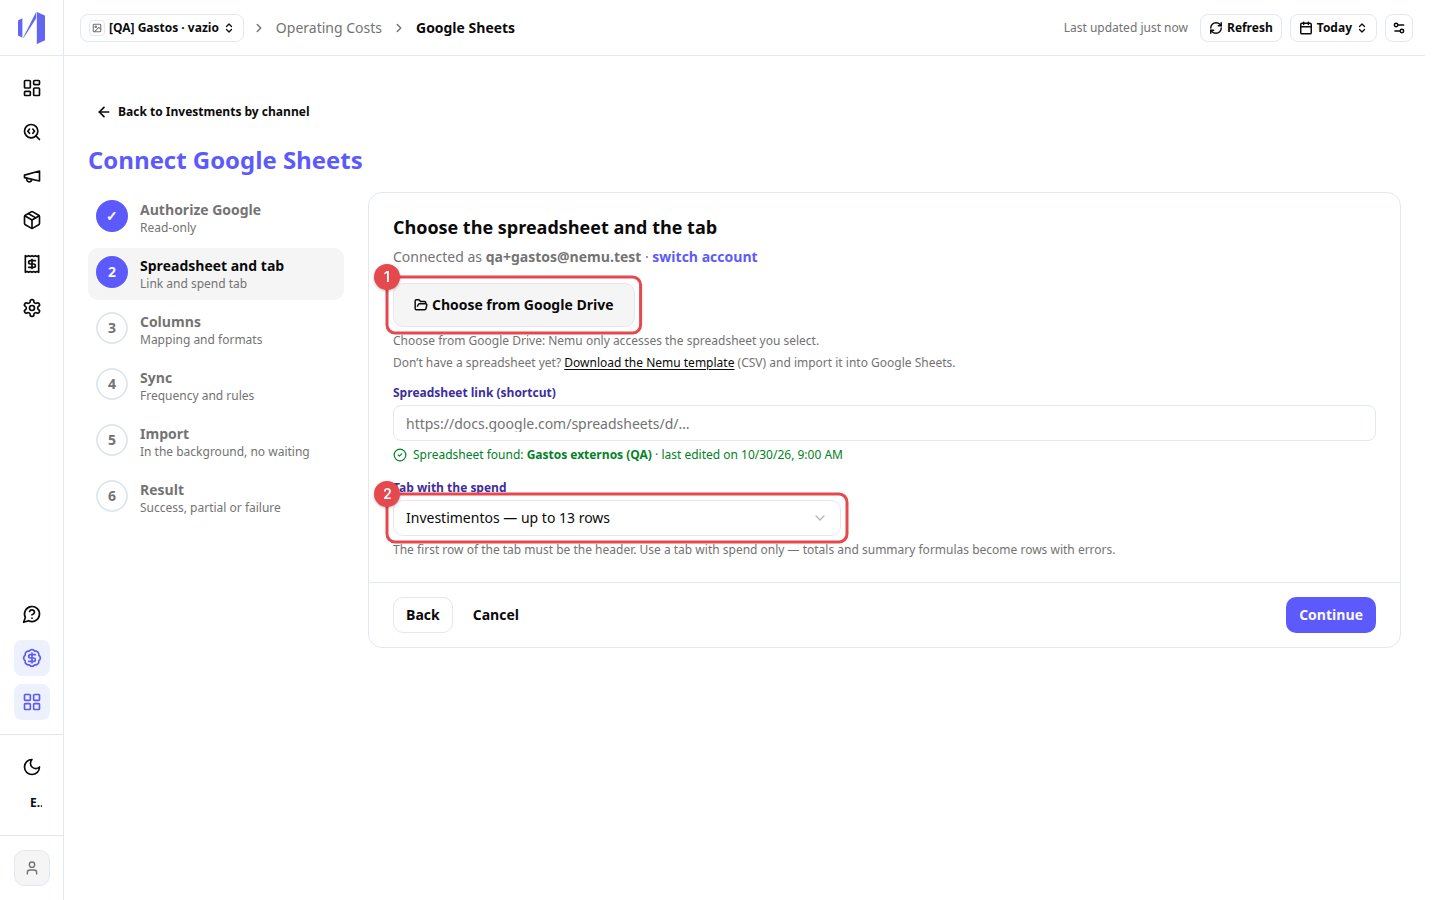
https://docs.google.com/spreadsheets/. If the connected account has no access, choosing from Google Drive grants read access.4
Match the columns
In the Columns step: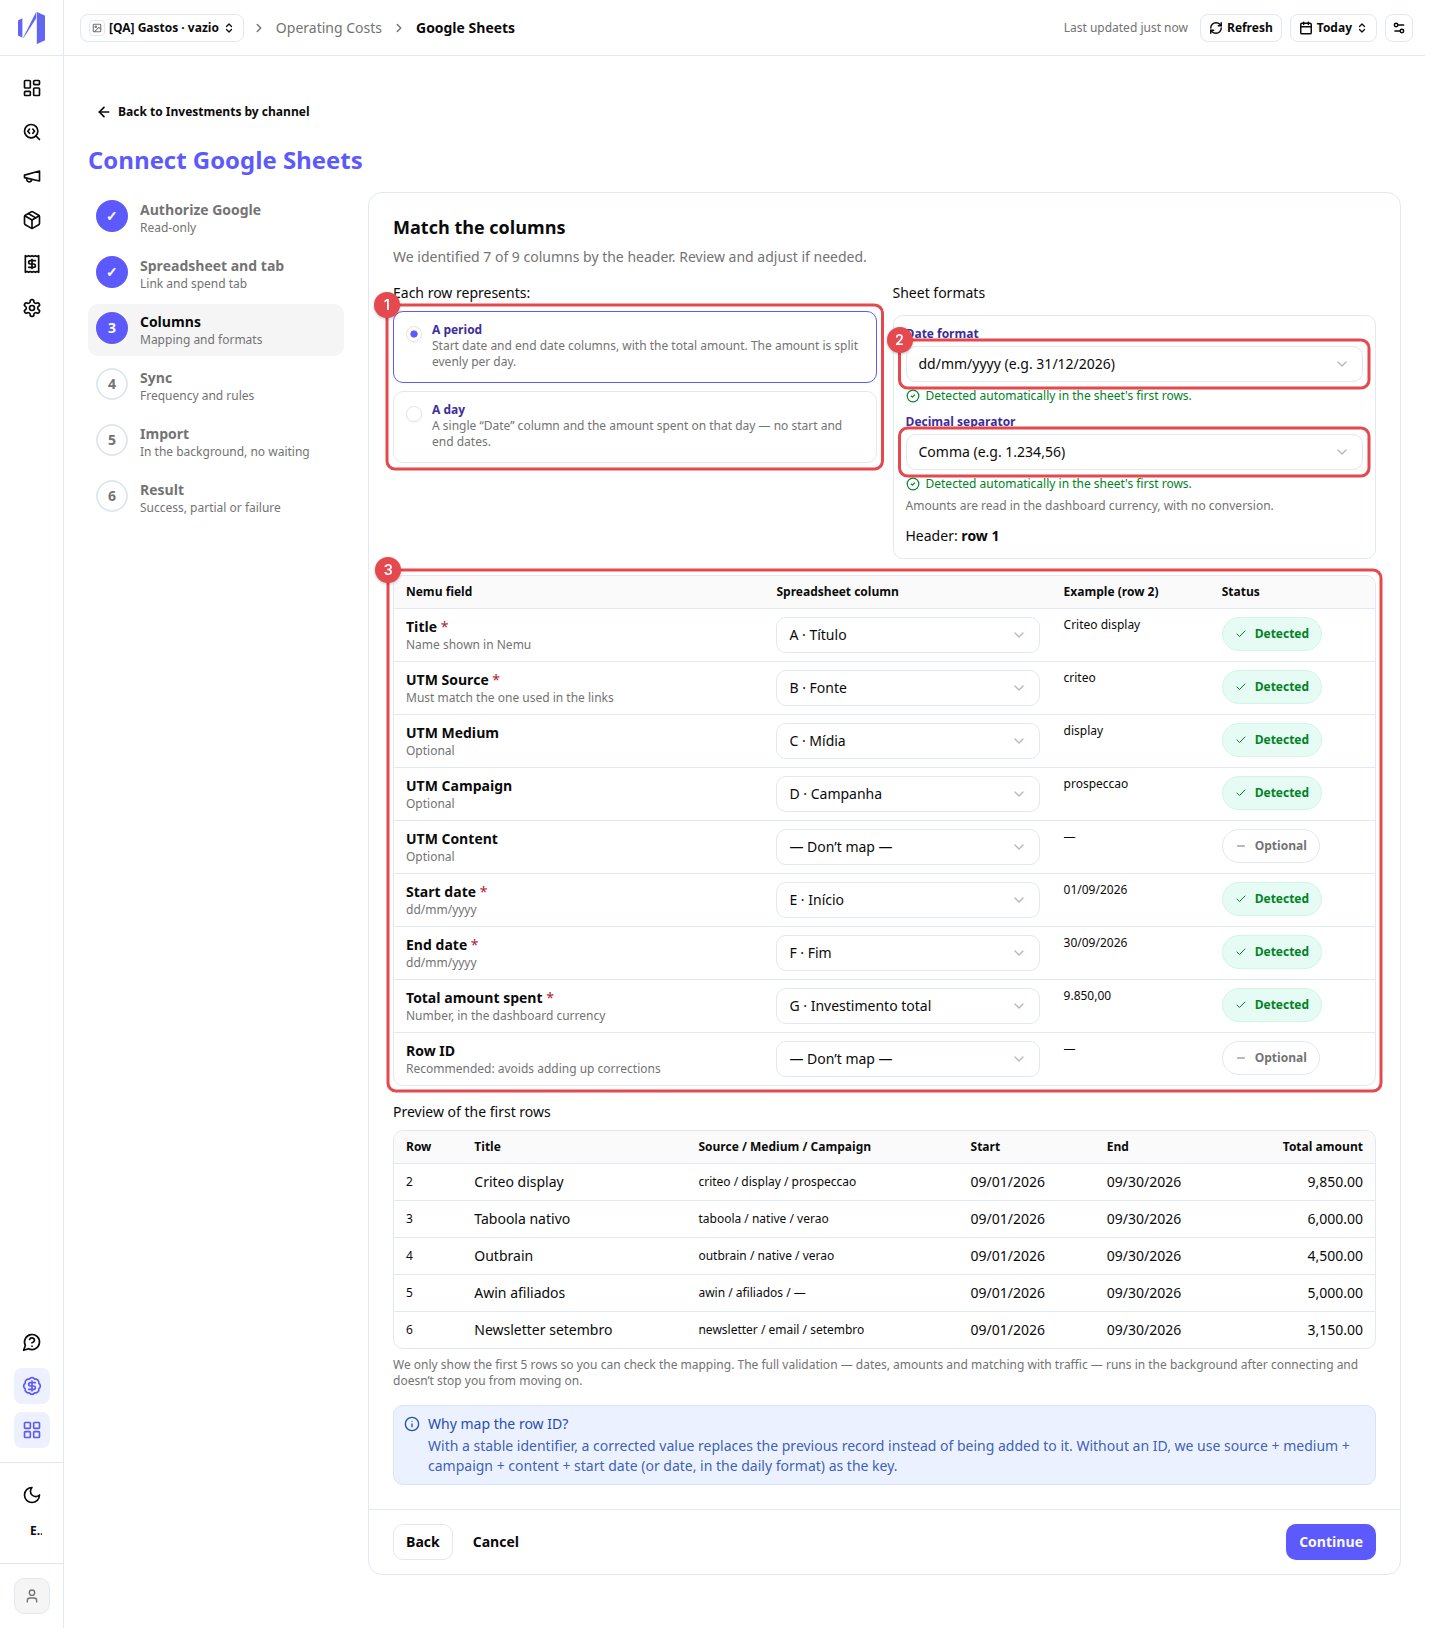
- In Each row represents:, choose A period or A day.
- Under the spreadsheet formats, check the Date format and the Decimal separator. Nemu detects both in the first rows; if it doesn’t find enough clues, it uses the default and asks you to check. You can change both.
- Check the spreadsheet column chosen for each field. Required fields have an asterisk, and the Status column shows what was detected.
5
Set up the sync
In the Sync step, choose: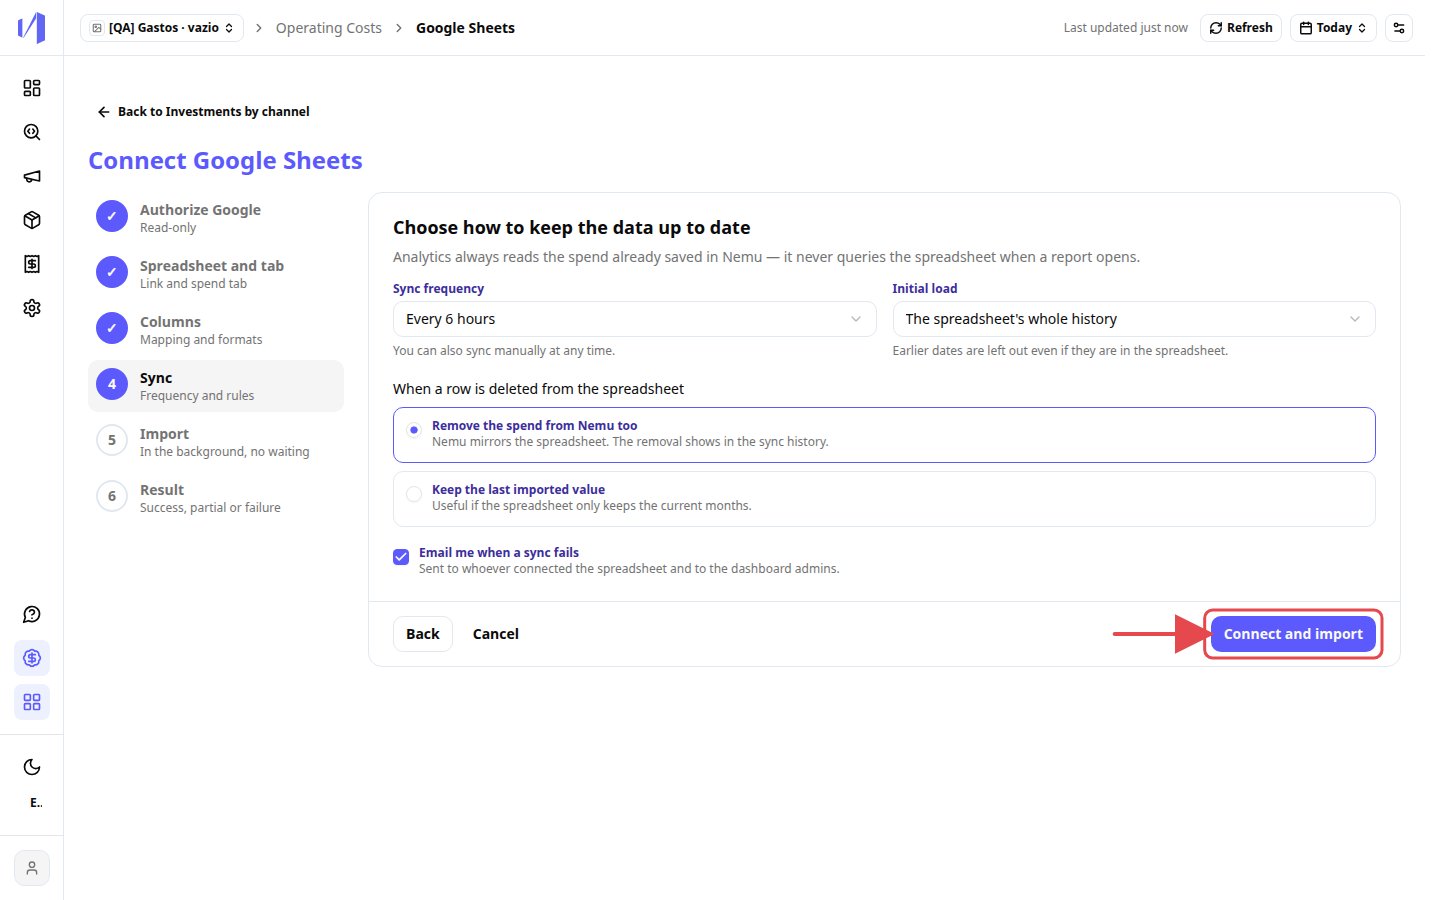
- Sync frequency: every 2, 6, 12 or 24 hours (the default is every 6 hours). You can also sync manually at any time.
- Initial load: The spreadsheet’s whole history or From a date. Earlier dates are left out even if they are in the spreadsheet.
- When a row is deleted from the spreadsheet: Remove the spend from Nemu too (Nemu mirrors the spreadsheet) or Keep the last imported value (useful if the spreadsheet only keeps the current months).
- Email me when a sync fails: the email goes to whoever connected the spreadsheet and to the dashboard admins.
6
Follow the import
The connection is already saved. The import keeps running even if you leave now. Click Continue in background if you don’t want to wait: Nemu emails you when it’s done, and the Investments by channel tab shows the progress.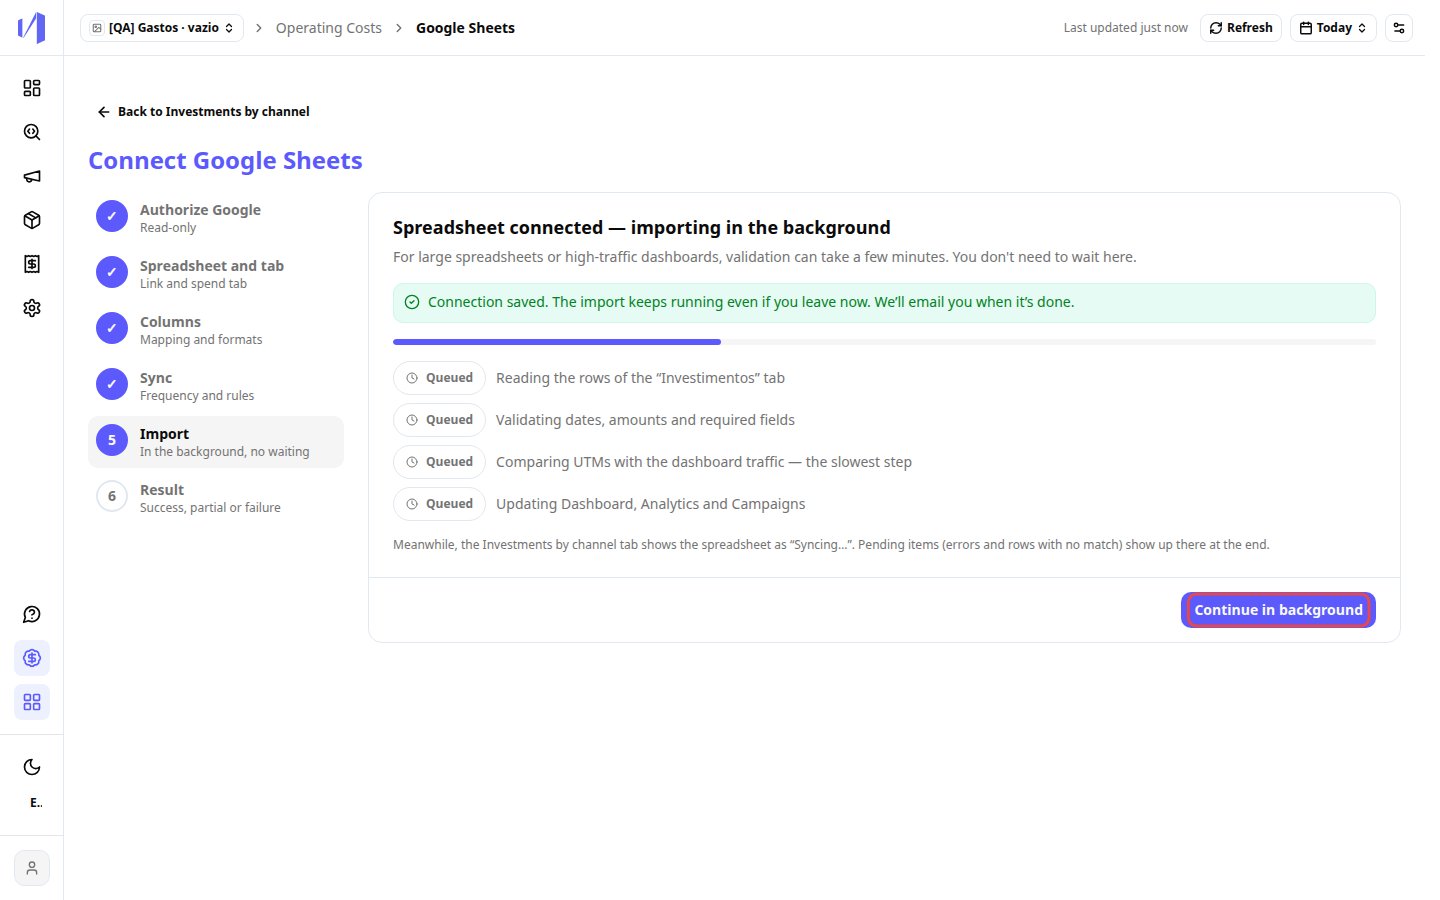
7
Check the result
The Result step summarizes the rows read, imported, ignored (integrated platform) and with errors. When there are pending items, the title shows how many there are, and the list below gives the spreadsheet row and the reason for each one (the See pending items in Management link opens the full list). Fix them in the spreadsheet: rows are validated again on the next sync, or right away if you click Sync now in the Investments by channel tab.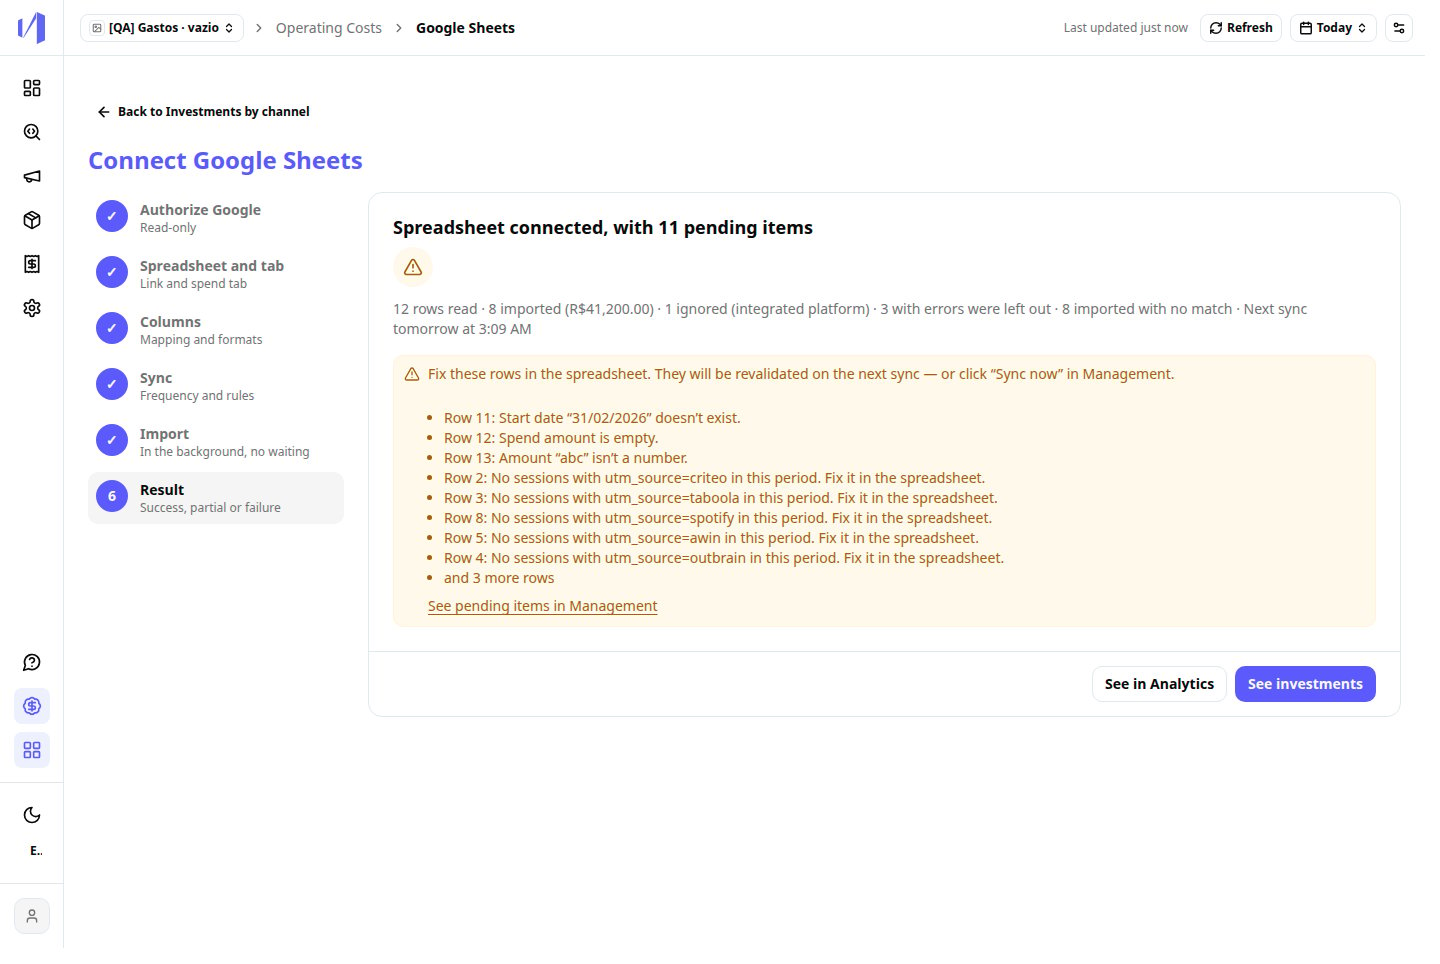
Follow up in Investments by channel
The Operating Costs › Investments by channel tab brings together everything you recorded: what comes from the spreadsheet, what was added manually and what was imported from a file.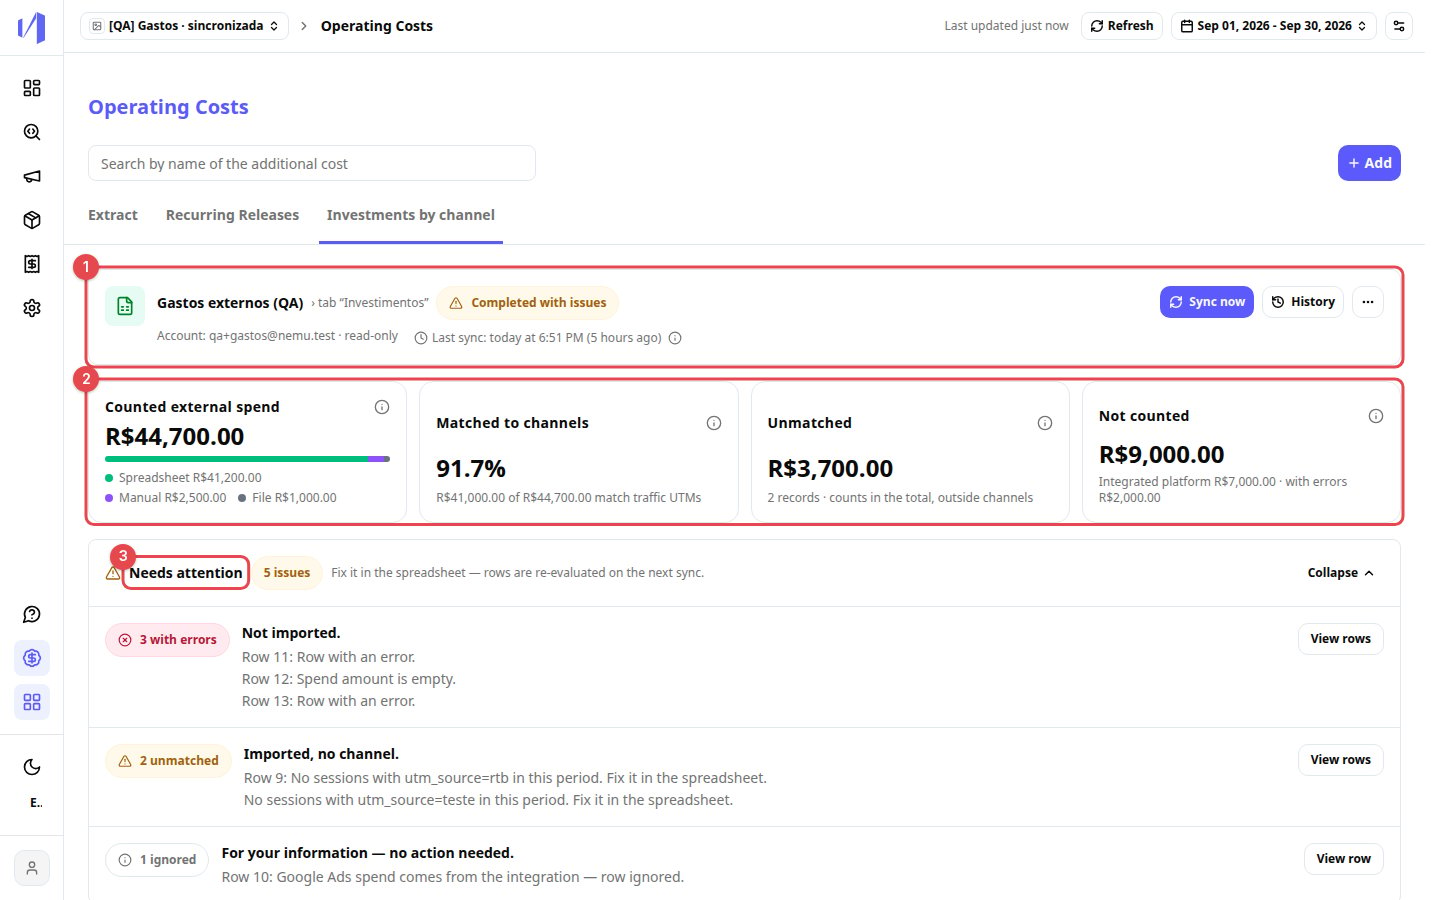
- Connection card: spreadsheet and tab name, connected account, status and last sync. The icon next to it shows the next sync and the frequency. The Sync now and History buttons are on the right.
- Indicators for the selected period:
- Counted external spend: sum of Spreadsheet, Manual and File, split by source.
- Matched to channels: the part of the spend whose UTMs match the dashboard traffic.
- Unmatched: amount and number of records whose UTMs don’t appear in the traffic for the period. This spend still goes into Analytics, in the channel of its own UTMs.
- Not counted: ignored rows (platform with a native integration) and rows with errors. They don’t add up to the total.
- Needs attention: groups the pending items in three groups (with errors, unmatched and ignored), with the spreadsheet row and the reason. View rows filters the table to show only those rows.
Connection status
Table, filters and export
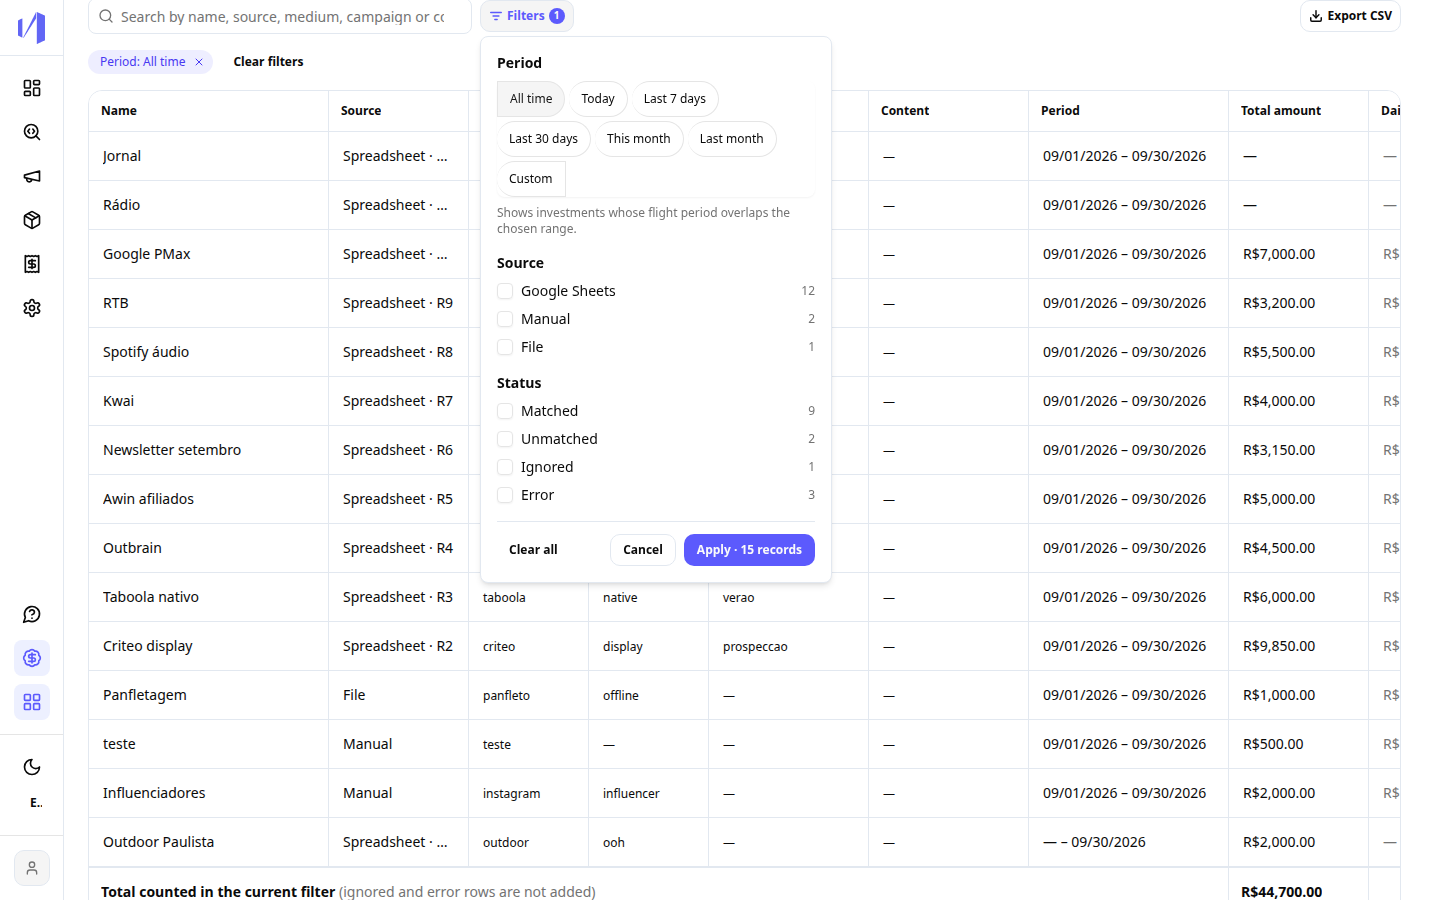
The table lists each investment with Name, Source (for example, Spreadsheet · R9 for row 9 of the spreadsheet), UTM source, Medium, Campaign, Content, Period, Total amount, Daily amount and Status (Matched, Unmatched, Ignored or Error). Hover over the status to see the reason or the last amount correction. The footer shows the Total counted in the current filter; ignored rows and rows with errors don’t add up. Rows that come from the spreadsheet are read-only in Nemu (“Managed by the spreadsheet — edit it at the source.”). To fix them, change the spreadsheet. Manual and file rows can be edited or deleted in the table itself. Use the search to look up by name, source, medium, campaign or content, and the Filters button to filter by:- Period: All time, Today, Last 7 days, Last 30 days, This month, Last month or Custom. It shows the investments whose flight period overlaps the chosen range. All time also includes investments with future dates.
- Source: Google Sheets, Manual or File.
- Status: Matched, Unmatched, Ignored or Error.
Sync history
Click History to see each run: date and time, status (Success, With issues or Failed), whether it was automatic or manual, the duration and the counts of rows read, new, updated, removed, ignored and with errors. Amount corrections show as “before → after (replaced, not added)”.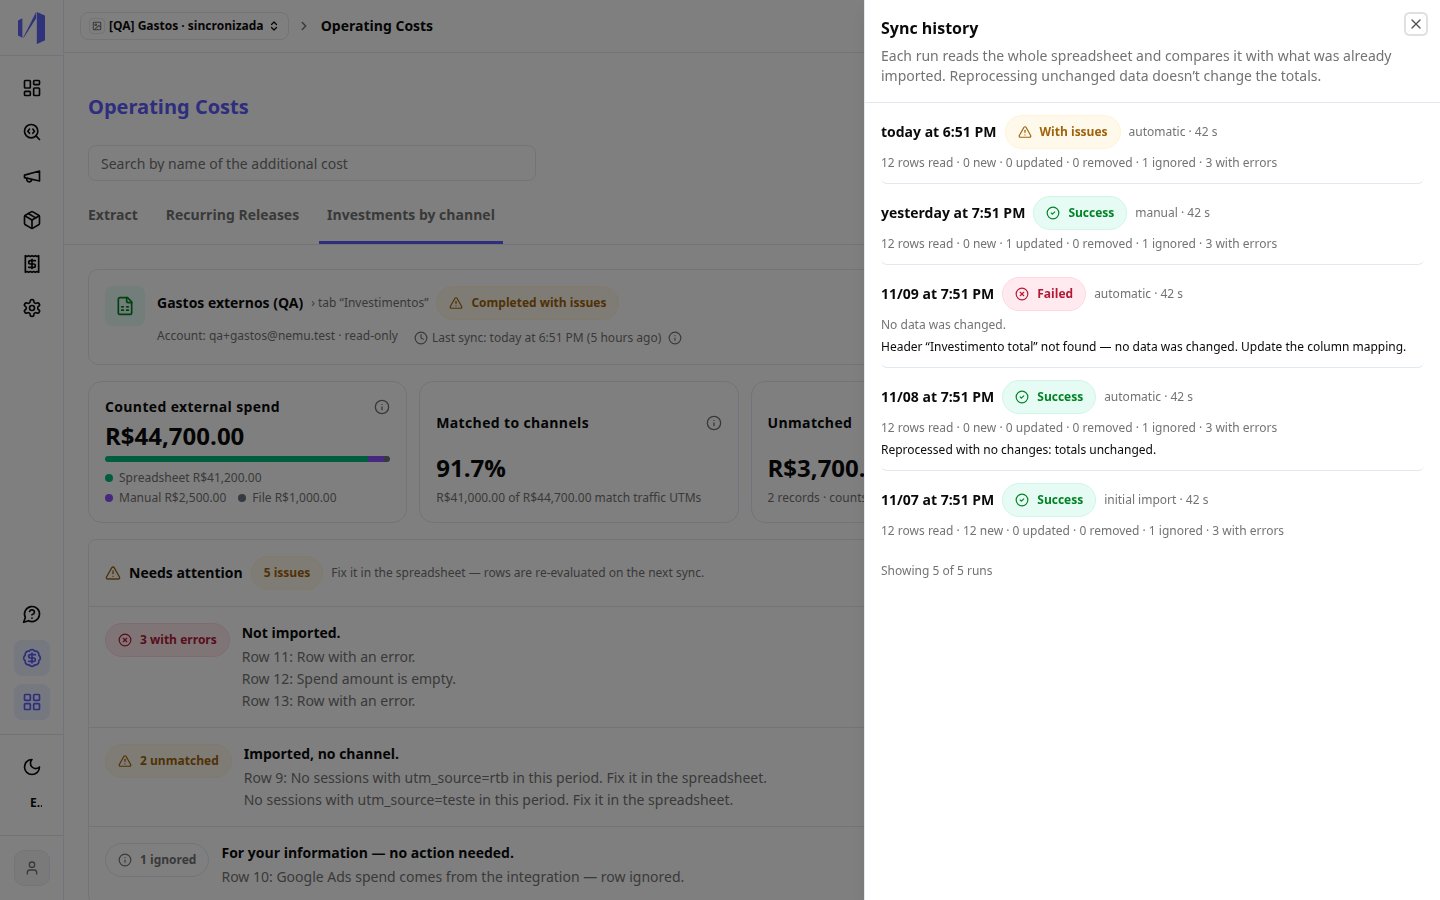
Keeping data up to date
- Nemu syncs on its own at the chosen frequency. On each sync, it reads the whole tab and compares it with what was already imported: new rows come in, corrected amounts replace the previous one (they aren’t added) and reprocessing the same spreadsheet with no changes doesn’t change the totals.
- To update right away, click Sync now. Only one sync runs at a time; while it runs, the button is disabled.
- If a sync fails, no data is changed: the previous values stay in your reports.
- Analytics always reads the spend already saved in Nemu. It never queries the spreadsheet when you open a report.
Change the connection
The ⋯ button on the connection card has Edit mapping and Disconnect. Edit mapping opens the wizard with your current choices, so you can change columns, formats or the sync and click Save and import.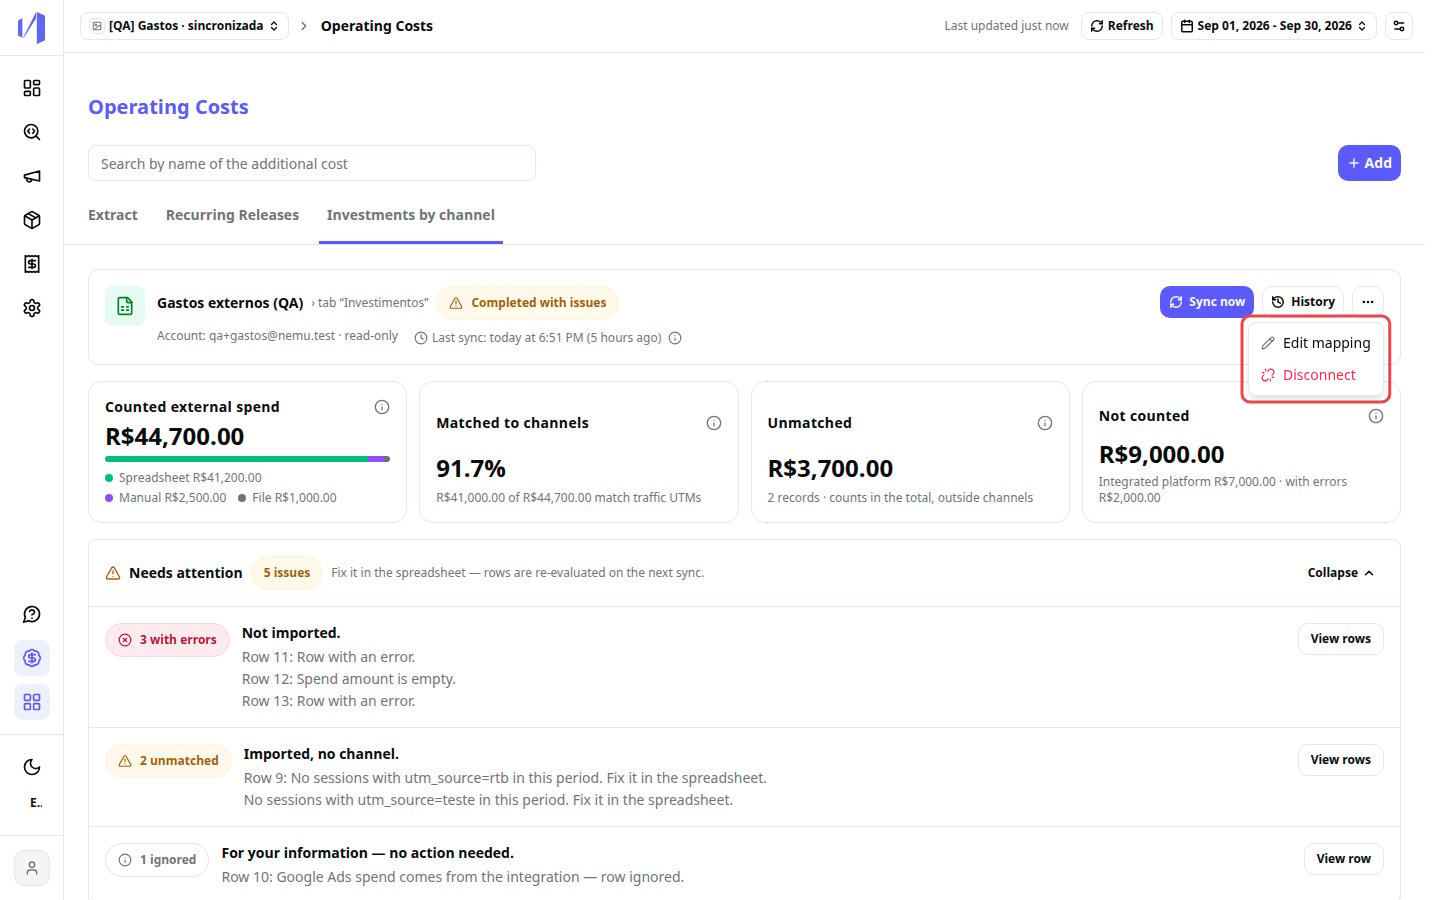
Where the spend shows up
After the import, the spreadsheet spend goes into your reports together with the spend from integrations. Each row goes to the channel defined by its UTMs, even when those UTMs haven’t had traffic in the period yet.Analytics
In Analytics (the Sources screen), the Spend column (1) shows the investment of each channel group, and the Last Click ROAS column (2) uses that spend (its name follows the chosen attribution model). In the example, the Display e nativo group adds up to 23,550.00 of spend, and the period total is 44,700.00, the same amount counted in the Investments by channel tab.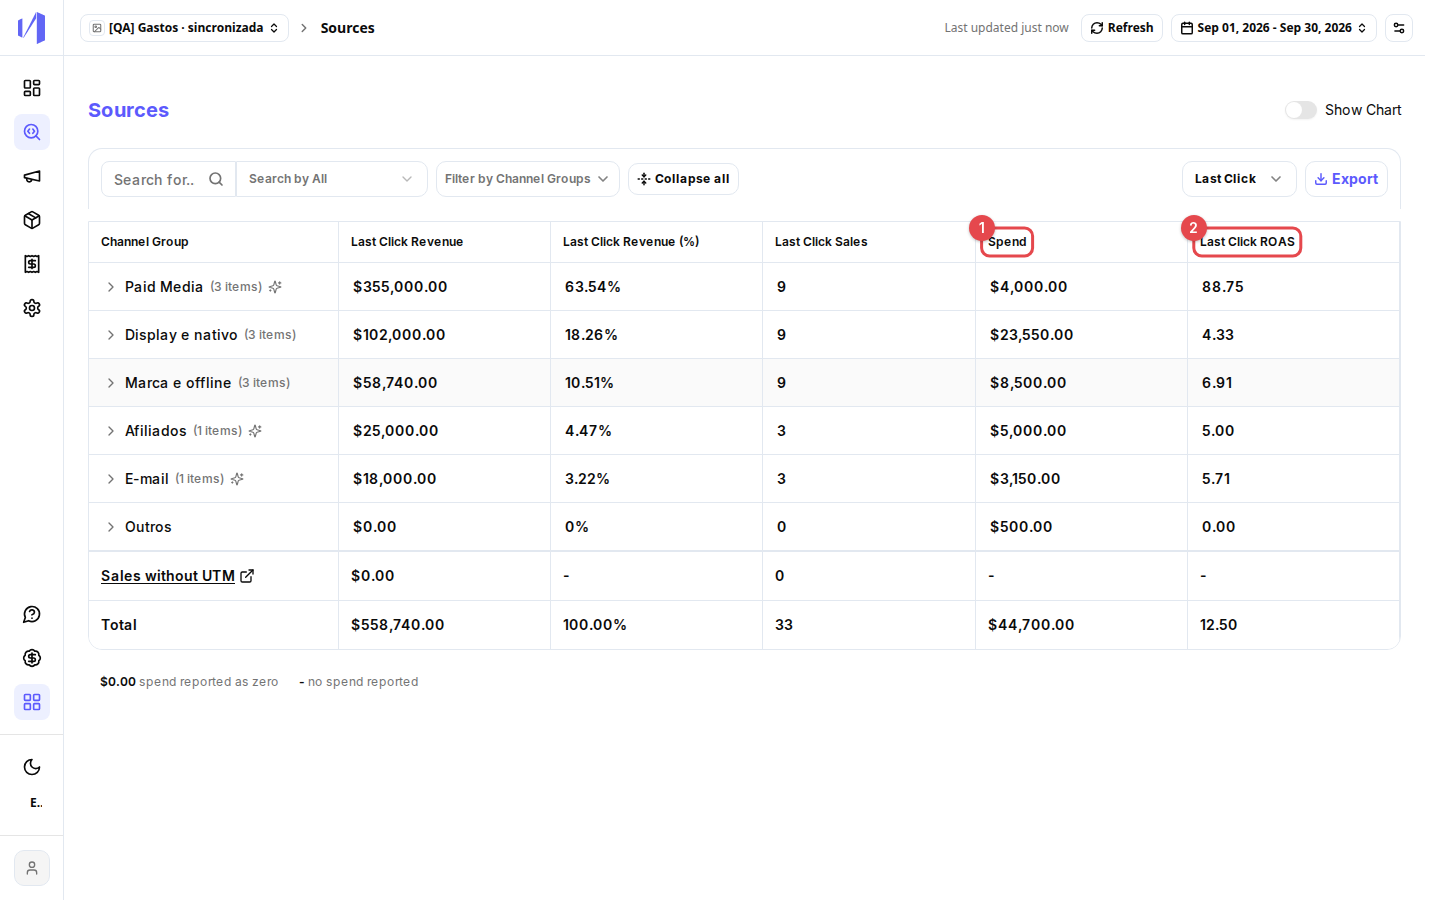
Campaigns
In Campaigns › All Channels, the Spent column feeds the profit, ROI and ROAS of each channel.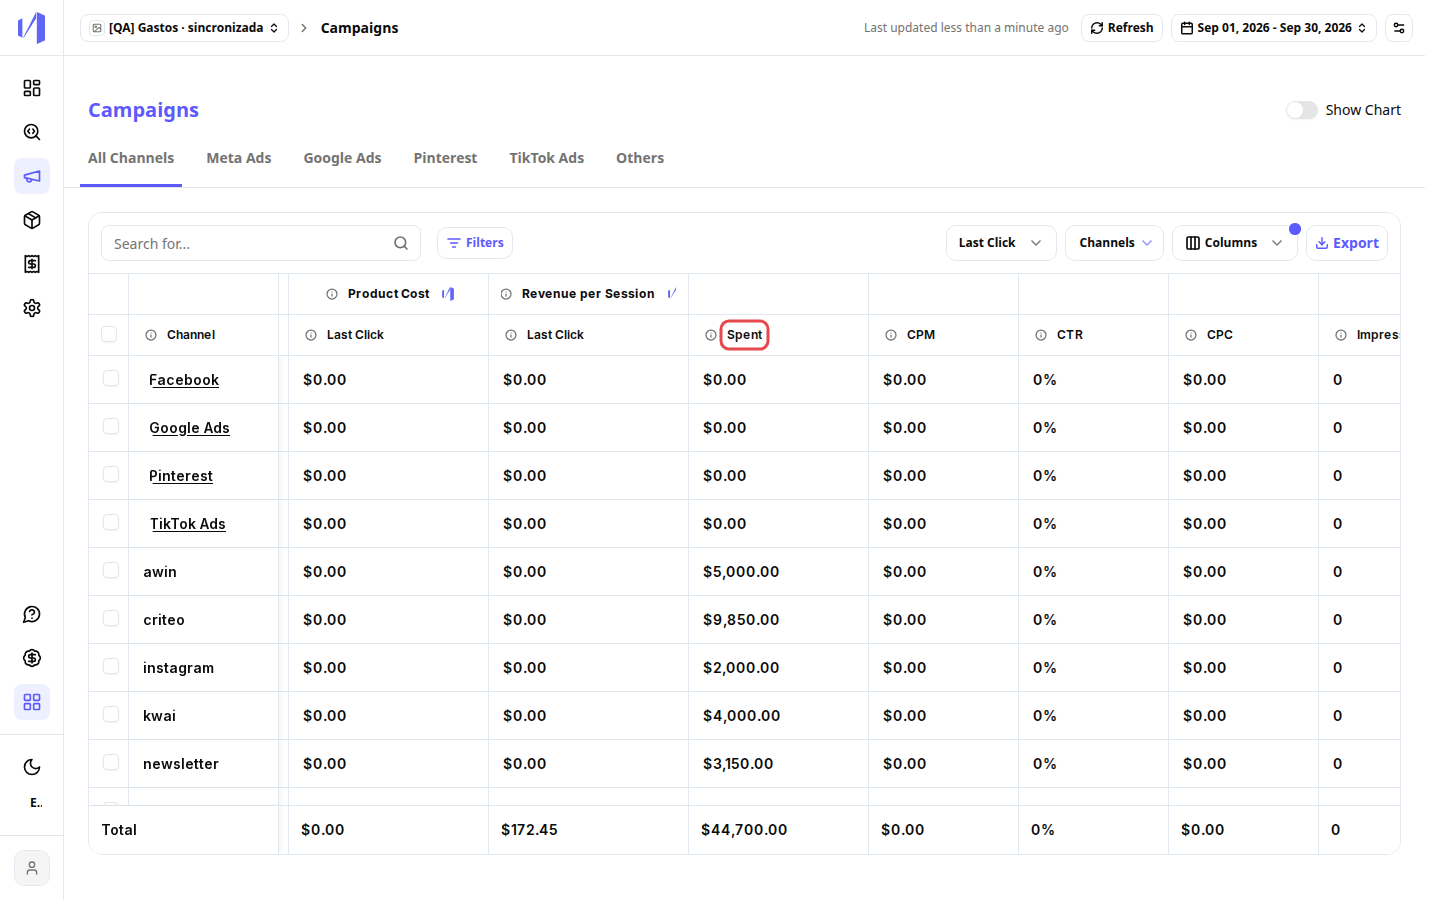
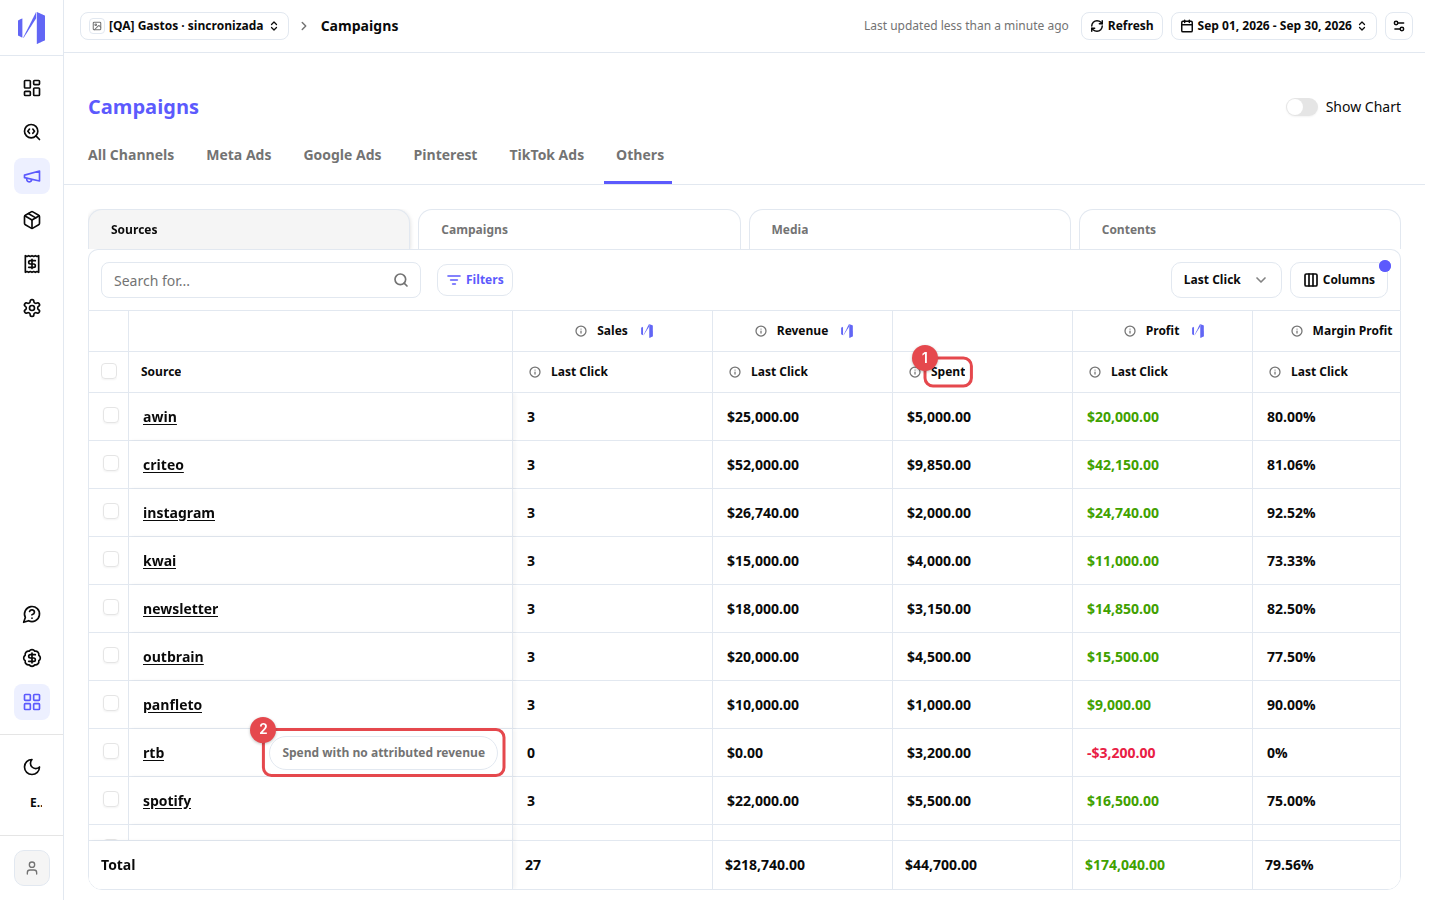
The difference between “matched” and “unmatched” only shows up in Investments by channel. It helps you check whether the spreadsheet UTMs are right. In your reports, all counted spend goes in through the channel of the row’s UTMs.
Common errors
Access expired
If the Google account authorization expires or is revoked, the Investments by channel tab shows a red warning with the date since the spreadsheet stopped being read. Spend already imported stays in your reports, with data up to the last successful sync, and the sync is paused.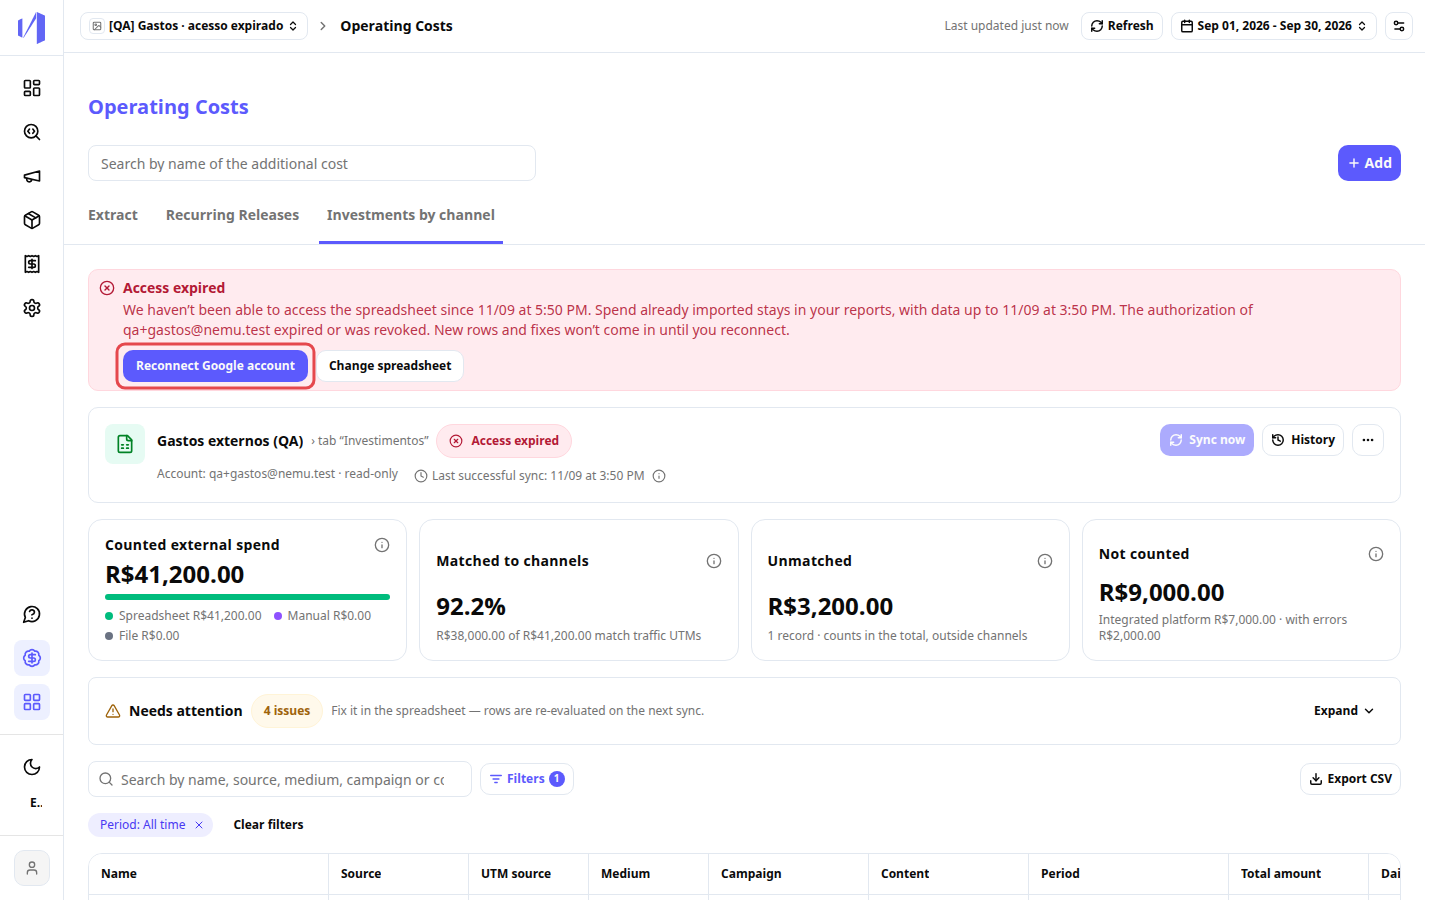
- Click Reconnect Google account to authorize again. Nemu syncs right after to recover the changes.
- Or click Change spreadsheet to connect another spreadsheet. First, Nemu asks whether the previous spreadsheet’s spend should be removed or kept as read-only.
Disconnect the spreadsheet
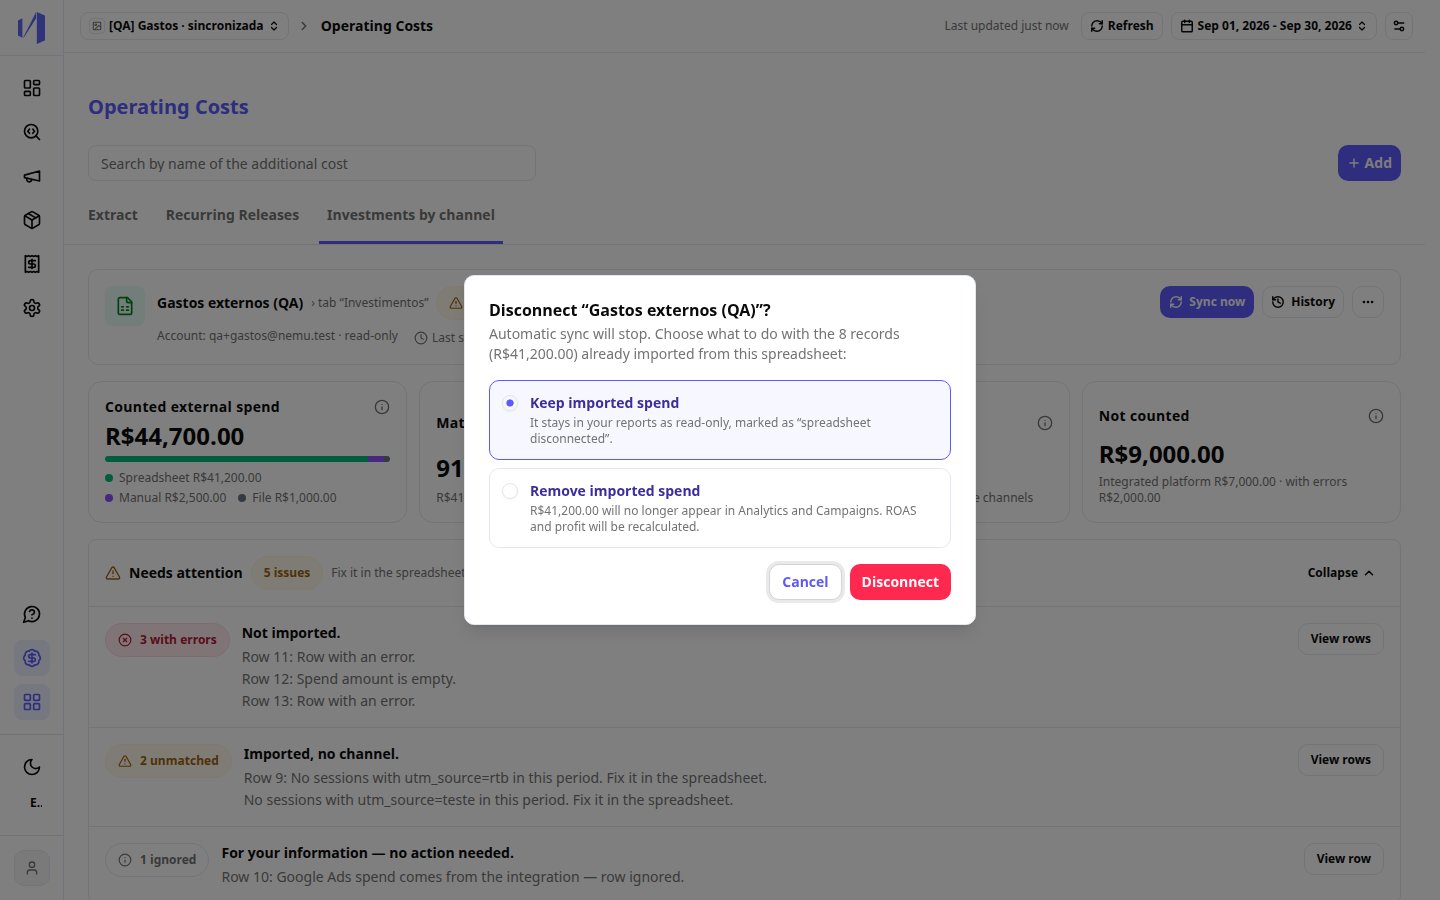
On the ⋯ button of the connection card, click Disconnect. The window shows how many records and how much spend were imported and asks you to choose:- Keep imported spend: it stays in your reports as read-only, marked as “spreadsheet disconnected”.
- Remove imported spend: the amount no longer appears in Analytics and Campaigns. ROAS and profit are recalculated.
FAQ
Do I need to make the spreadsheet public?
Do I need to make the spreadsheet public?
No. The spreadsheet stays private. Nemu only reads the spreadsheet you choose, with the Google account you authorized.
I fixed an amount in the spreadsheet. Will it be added twice?
I fixed an amount in the spreadsheet. Will it be added twice?
No. On the next sync, the new amount replaces the previous one, and the history shows the change as “replaced, not added”. For Nemu to recognize the same row even when you change the UTMs or the date, map the Row ID column.
Can I keep adding investments manually or from a file?
Can I keep adding investments manually or from a file?
Yes. Manual and file investments keep working and show up in the same table, with the source Manual or File.
The spreadsheet has Meta Ads or Google Ads spend. What happens?
The spreadsheet has Meta Ads or Google Ads spend. What happens?
Those rows are ignored and don’t add up to the total. Spend from these platforms always comes from the native integration, so it isn’t counted twice.
A row is unmatched. Does its spend disappear from my reports?
A row is unmatched. Does its spend disappear from my reports?
No. The spend goes into Analytics and Campaigns in the channel of its own UTMs. “Unmatched” only warns that those UTMs had no traffic in the period: check that they’re written the same way as in your links.
Which currency are amounts read in?
Which currency are amounts read in?
In the dashboard currency, with no conversion. Symbols like R$ or US$ in the cell are ignored.
Can I connect more than one spreadsheet?
Can I connect more than one spreadsheet?
Today, each dashboard has one connected spreadsheet. To use another one, disconnect the current one or use Change spreadsheet when access expires.
The Google Sheets page describes an older integration, set up with the tab ID (GID). To bring spend from channels without an integration into Analytics, use the connection described on this page.